|
Download Data (XLS File) |
|
||||||||
|
||||||||
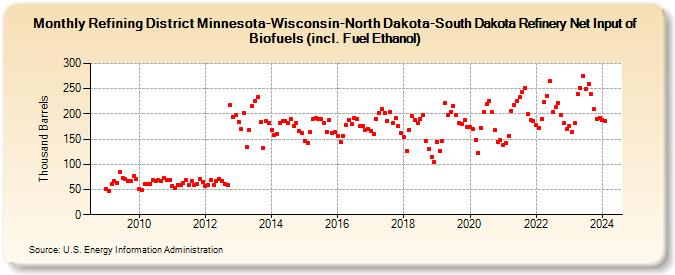
| Refining District Minnesota-Wisconsin-North Dakota-South Dakota Refinery Net Input of Biofuels (incl. Fuel Ethanol) (Thousand Barrels) | ||||||||
| Year | Jan | Feb | Mar | Apr | May | Jun | Jul | Aug | Sep | Oct | Nov | Dec |
|---|---|---|---|---|---|---|---|---|---|---|---|---|
| 2009 | 52 | 48 | 61 | 66 | 63 | 84 | 72 | 71 | 67 | 67 | 76 | 70 |
| 2010 | 52 | 49 | 60 | 60 | 61 | 68 | 67 | 68 | 67 | 73 | 68 | 69 |
| 2011 | 57 | 53 | 59 | 58 | 63 | 69 | 59 | 67 | 59 | 61 | 70 | 64 |
| 2012 | 56 | 59 | 69 | 59 | 66 | 71 | 66 | 60 | 58 | 218 | 193 | 198 |
| 2013 | 183 | 170 | 202 | 135 | 168 | 216 | 225 | 234 | 183 | 133 | 186 | 181 |
| 2014 | 169 | 158 | 161 | 182 | 185 | 186 | 181 | 190 | 176 | 182 | 167 | 162 |
| 2015 | 146 | 143 | 164 | 189 | 191 | 189 | 190 | 182 | 165 | 187 | 162 | 164 |
| 2016 | 157 | 145 | 157 | 177 | 187 | 180 | 191 | 189 | 176 | 175 | 169 | 171 |
| 2017 | 166 | 160 | 190 | 202 | 210 | 202 | 186 | 204 | 181 | 192 | 175 | 162 |
| 2018 | 154 | 126 | 169 | 196 | 188 | 182 | 189 | 198 | 147 | 130 | 115 | 105 |
| 2019 | 144 | 127 | 146 | 221 | 198 | 203 | 216 | 197 | 182 | 179 | 187 | 174 |
| 2020 | 174 | 170 | 149 | 123 | 172 | 204 | 220 | 225 | 203 | 168 | 145 | 148 |
| 2021 | 139 | 143 | 156 | 206 | 217 | 225 | 233 | 243 | 251 | 199 | 187 | 185 |
| 2022 | 177 | 173 | 189 | 223 | 235 | 265 | 203 | 213 | 222 | 197 | 182 | 170 |
| 2023 | 175 | 164 | 181 | 239 | 252 | 275 | 250 | 260 | 240 | 209 | 190 | 191 |
| 2024 | 187 | 186 | 234 | 286 | 278 | 283 | ||||||
| - = No Data Reported; -- = Not Applicable; NA = Not Available; W = Withheld to avoid disclosure of individual company data. |
| Release Date: 8/30/2024 |
| Next Release Date: 9/30/2024 |