|
Download Data (XLS File) |
|
||||||||
|
||||||||
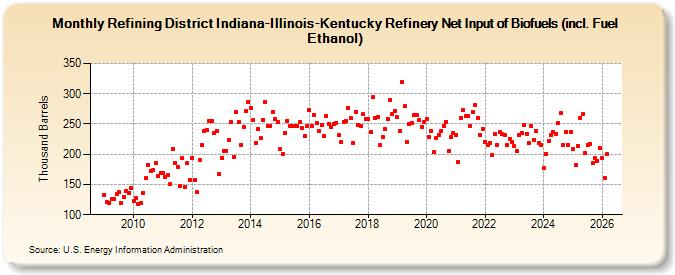
| Refining District Indiana-Illinois-Kentucky Refinery Net Input of Biofuels (incl. Fuel Ethanol) (Thousand Barrels) | ||||||||
| Year | Jan | Feb | Mar | Apr | May | Jun | Jul | Aug | Sep | Oct | Nov | Dec |
|---|---|---|---|---|---|---|---|---|---|---|---|---|
| 2009 | 133 | 121 | 120 | 126 | 126 | 134 | 137 | 119 | 130 | 139 | 136 | 144 |
| 2010 | 122 | 127 | 117 | 120 | 136 | 160 | 183 | 173 | 174 | 185 | 164 | 169 |
| 2011 | 169 | 162 | 165 | 151 | 209 | 186 | 179 | 148 | 193 | 146 | 185 | 157 |
| 2012 | 193 | 157 | 137 | 191 | 216 | 238 | 240 | 255 | 255 | 235 | 238 | 168 |
| 2013 | 193 | 205 | 205 | 224 | 253 | 195 | 269 | 254 | 216 | 245 | 271 | 286 |
| 2014 | 276 | 256 | 218 | 241 | 226 | 257 | 286 | 246 | 247 | 269 | 258 | 253 |
| 2015 | 208 | 200 | 235 | 255 | 247 | 246 | 246 | 247 | 253 | 243 | 230 | 246 |
| 2016 | 273 | 247 | 265 | 252 | 238 | 248 | 230 | 263 | 250 | 245 | 250 | 252 |
| 2017 | 231 | 221 | 253 | 255 | 276 | 260 | 218 | 270 | 249 | 247 | 266 | 258 |
| 2018 | 258 | 237 | 294 | 260 | 262 | 216 | 228 | 242 | 259 | 290 | 266 | 272 |
| 2019 | 261 | 238 | 320 | 279 | 221 | 250 | 252 | 265 | 265 | 256 | 245 | 254 |
| 2020 | 258 | 229 | 238 | 203 | 227 | 231 | 239 | 247 | 254 | 205 | 228 | 235 |
| 2021 | 231 | 187 | 260 | 273 | 264 | 263 | 246 | 270 | 281 | 260 | 231 | 242 |
| 2022 | 221 | 215 | 219 | 198 | 233 | 215 | 236 | 233 | 232 | 215 | 225 | 221 |
| 2023 | 213 | 205 | 231 | 235 | 249 | 234 | 218 | 246 | 224 | 238 | 218 | 215 |
| 2024 | 177 | |||||||||||
| - = No Data Reported; -- = Not Applicable; NA = Not Available; W = Withheld to avoid disclosure of individual company data. |
| Release Date: 3/29/2024 |
| Next Release Date: 4/30/2024 |