|
Download Data (XLS File) |
|
||||||||
|
||||||||
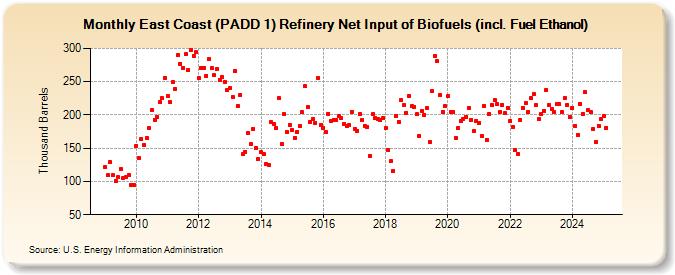
| East Coast (PADD 1) Refinery Net Input of Biofuels (incl. Fuel Ethanol) (Thousand Barrels) | ||||||||
| Year | Jan | Feb | Mar | Apr | May | Jun | Jul | Aug | Sep | Oct | Nov | Dec |
|---|---|---|---|---|---|---|---|---|---|---|---|---|
| 2009 | 122 | 109 | 129 | 109 | 101 | 106 | 119 | 105 | 107 | 109 | 94 | 95 |
| 2010 | 154 | 135 | 164 | 155 | 166 | 180 | 207 | 193 | 197 | 219 | 225 | 256 |
| 2011 | 228 | 219 | 249 | 239 | 290 | 277 | 271 | 291 | 268 | 298 | 289 | 294 |
| 2012 | 256 | 271 | 271 | 259 | 284 | 270 | 260 | 269 | 253 | 257 | 250 | 237 |
| 2013 | 240 | 227 | 266 | 214 | 230 | 141 | 145 | 173 | 156 | 179 | 150 | 134 |
| 2014 | 144 | 141 | 126 | 125 | 189 | 187 | 180 | 225 | 157 | 201 | 174 | 185 |
| 2015 | 178 | 166 | 175 | 183 | 204 | 243 | 212 | 190 | 194 | 188 | 256 | 185 |
| 2016 | 181 | 174 | 202 | 191 | 193 | 193 | 198 | 195 | 187 | 184 | 185 | 205 |
| 2017 | 179 | 176 | 201 | 192 | 184 | 182 | 139 | 201 | 195 | 194 | 192 | 195 |
| 2018 | 180 | 148 | 130 | 116 | 199 | 190 | 222 | 215 | 203 | 229 | 213 | 212 |
| 2019 | 201 | 169 | 206 | 200 | 211 | 160 | 236 | 289 | 281 | 230 | 205 | 213 |
| 2020 | 228 | 205 | 204 | 166 | 180 | 191 | 194 | 197 | 211 | 192 | 176 | 191 |
| 2021 | 188 | 169 | 214 | 163 | 202 | 215 | 222 | 216 | 204 | 215 | 203 | 211 |
| 2022 | 191 | 182 | 148 | 142 | 193 | 211 | 218 | 205 | 225 | 231 | 215 | 194 |
| 2023 | 201 | 206 | 238 | 215 | 209 | 204 | 217 | 216 | 204 | 226 | 215 | 197 |
| 2024 | 211 | |||||||||||
| - = No Data Reported; -- = Not Applicable; NA = Not Available; W = Withheld to avoid disclosure of individual company data. |
| Release Date: 3/29/2024 |
| Next Release Date: 4/30/2024 |