|
Download Data (XLS File) |
|
||||||||
|
||||||||
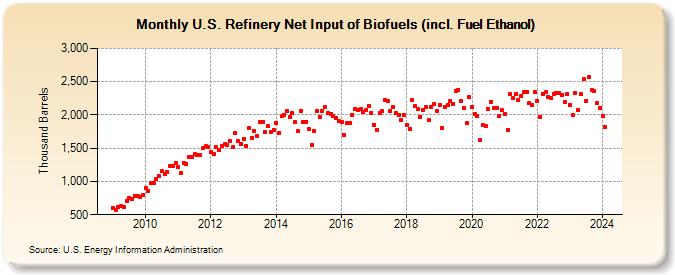
| U.S. Refinery Net Input of Biofuels (incl. Fuel Ethanol) (Thousand Barrels) | ||||||||
| Year | Jan | Feb | Mar | Apr | May | Jun | Jul | Aug | Sep | Oct | Nov | Dec |
|---|---|---|---|---|---|---|---|---|---|---|---|---|
| 2009 | 608 | 572 | 614 | 625 | 612 | 710 | 756 | 737 | 785 | 788 | 767 | 791 |
| 2010 | 898 | 854 | 974 | 974 | 1,034 | 1,076 | 1,150 | 1,105 | 1,146 | 1,231 | 1,226 | 1,283 |
| 2011 | 1,211 | 1,131 | 1,278 | 1,268 | 1,375 | 1,370 | 1,409 | 1,396 | 1,393 | 1,496 | 1,532 | 1,513 |
| 2012 | 1,441 | 1,406 | 1,515 | 1,473 | 1,537 | 1,556 | 1,550 | 1,610 | 1,520 | 1,724 | 1,607 | 1,566 |
| 2013 | 1,632 | 1,532 | 1,800 | 1,656 | 1,762 | 1,677 | 1,892 | 1,899 | 1,737 | 1,827 | 1,743 | 1,775 |
| 2014 | 1,876 | 1,727 | 1,979 | 2,000 | 2,056 | 1,971 | 2,023 | 1,889 | 1,753 | 2,053 | 1,899 | 1,897 |
| 2015 | 1,782 | 1,543 | 1,762 | 2,057 | 1,968 | 2,062 | 2,122 | 2,023 | 2,016 | 1,985 | 1,961 | 1,912 |
| 2016 | 1,888 | 1,693 | 1,882 | 1,880 | 2,000 | 2,085 | 2,076 | 2,089 | 2,041 | 2,069 | 2,140 | 2,031 |
| 2017 | 1,855 | 1,779 | 2,036 | 2,057 | 2,224 | 2,213 | 2,053 | 2,114 | 2,022 | 2,004 | 1,922 | 2,002 |
| 2018 | 1,852 | 1,790 | 2,229 | 2,129 | 2,096 | 1,976 | 2,079 | 2,112 | 1,925 | 2,123 | 2,158 | 2,064 |
| 2019 | 2,142 | 1,798 | 2,119 | 2,142 | 2,210 | 2,159 | 2,353 | 2,380 | 2,207 | 2,109 | 1,886 | 2,267 |
| 2020 | 2,122 | 2,008 | 1,979 | 1,622 | 1,846 | 1,839 | 2,082 | 2,193 | 2,110 | 2,098 | 1,987 | 2,067 |
| 2021 | 2,019 | 1,778 | 2,320 | 2,250 | 2,313 | 2,226 | 2,285 | 2,337 | 2,342 | 2,173 | 2,155 | 2,339 |
| 2022 | 2,212 | 1,973 | 2,318 | 2,339 | 2,271 | 2,248 | 2,320 | 2,333 | 2,333 | 2,300 | 2,193 | 2,312 |
| 2023 | 2,155 | 1,997 | 2,329 | 2,078 | 2,314 | 2,534 | 2,216 | 2,564 | 2,375 | 2,363 | 2,176 | 2,108 |
| 2024 | 1,984 | |||||||||||
| - = No Data Reported; -- = Not Applicable; NA = Not Available; W = Withheld to avoid disclosure of individual company data. |
| Release Date: 3/29/2024 |
| Next Release Date: 4/30/2024 |