|
Download Data (XLS File) |
|
||||||||
|
||||||||
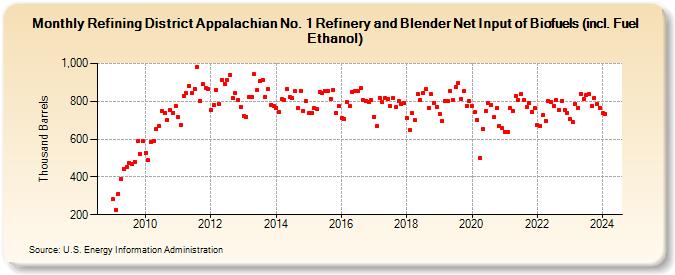
| Refining District Appalachian No. 1 Refinery and Blender Net Input of Biofuels (incl. Fuel Ethanol) (Thousand Barrels) | ||||||||
| Year | Jan | Feb | Mar | Apr | May | Jun | Jul | Aug | Sep | Oct | Nov | Dec |
|---|---|---|---|---|---|---|---|---|---|---|---|---|
| 2009 | 281 | 224 | 311 | 388 | 444 | 453 | 472 | 467 | 481 | 588 | 523 | 588 |
| 2010 | 528 | 489 | 584 | 592 | 652 | 670 | 750 | 740 | 703 | 753 | 740 | 776 |
| 2011 | 716 | 677 | 830 | 843 | 882 | 845 | 866 | 984 | 804 | 889 | 868 | 863 |
| 2012 | 754 | 779 | 861 | 786 | 915 | 894 | 912 | 940 | 820 | 844 | 807 | 771 |
| 2013 | 723 | 717 | 821 | 823 | 942 | 858 | 906 | 914 | 825 | 866 | 780 | 774 |
| 2014 | 766 | 744 | 810 | 806 | 866 | 823 | 818 | 853 | 762 | 855 | 750 | 799 |
| 2015 | 736 | 740 | 763 | 757 | 848 | 842 | 856 | 854 | 814 | 861 | 737 | 777 |
| 2016 | 711 | 705 | 796 | 776 | 847 | 853 | 852 | 870 | 805 | 802 | 795 | 805 |
| 2017 | 719 | 668 | 819 | 797 | 817 | 811 | 776 | 819 | 768 | 803 | 784 | 791 |
| 2018 | 709 | 648 | 738 | 701 | 836 | 806 | 845 | 864 | 765 | 836 | 792 | 772 |
| 2019 | 734 | 696 | 799 | 799 | 854 | 808 | 875 | 898 | 814 | 853 | 777 | 801 |
| 2020 | 776 | 741 | 700 | 502 | 651 | 746 | 790 | 783 | 715 | 762 | 671 | 658 |
| 2021 | 640 | 637 | 764 | 748 | 828 | 807 | 839 | 806 | 770 | 789 | 743 | 762 |
| 2022 | 673 | 671 | 726 | 697 | 802 | 795 | 776 | 808 | 753 | 802 | 755 | 740 |
| 2023 | 704 | 688 | 786 | 767 | 840 | 813 | 831 | 837 | 776 | 818 | 787 | 767 |
| 2024 | 737 | |||||||||||
| - = No Data Reported; -- = Not Applicable; NA = Not Available; W = Withheld to avoid disclosure of individual company data. |
| Release Date: 3/29/2024 |
| Next Release Date: 4/30/2024 |