|
Download Data (XLS File) |
|
||||||||
|
||||||||
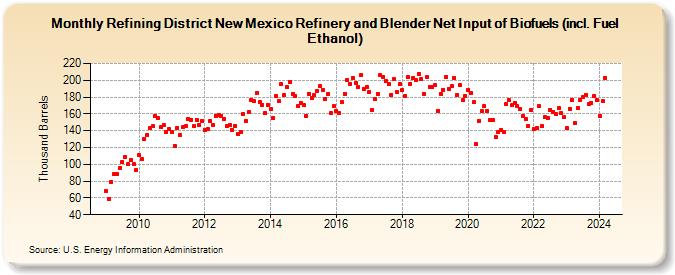
| Refining District New Mexico Refinery and Blender Net Input of Biofuels (incl. Fuel Ethanol) (Thousand Barrels) | ||||||||
| Year | Jan | Feb | Mar | Apr | May | Jun | Jul | Aug | Sep | Oct | Nov | Dec |
|---|---|---|---|---|---|---|---|---|---|---|---|---|
| 2009 | 68 | 59 | 79 | 89 | 89 | 96 | 103 | 109 | 100 | 105 | 100 | 93 |
| 2010 | 111 | 106 | 130 | 135 | 143 | 145 | 158 | 155 | 144 | 147 | 139 | 142 |
| 2011 | 138 | 122 | 143 | 135 | 144 | 145 | 154 | 153 | 145 | 153 | 147 | 152 |
| 2012 | 141 | 142 | 152 | 147 | 158 | 159 | 158 | 154 | 145 | 147 | 141 | 145 |
| 2013 | 136 | 139 | 160 | 152 | 162 | 177 | 175 | 185 | 174 | 171 | 161 | 171 |
| 2014 | 166 | 155 | 181 | 175 | 195 | 182 | 192 | 198 | 184 | 181 | 169 | 173 |
| 2015 | 171 | 158 | 184 | 179 | 182 | 187 | 193 | 189 | 178 | 184 | 161 | 169 |
| 2016 | 164 | 161 | 174 | 184 | 200 | 196 | 203 | 197 | 192 | 206 | 190 | 192 |
| 2017 | 186 | 165 | 178 | 184 | 206 | 204 | 199 | 195 | 183 | 201 | 186 | 195 |
| 2018 | 188 | 181 | 204 | 196 | 203 | 200 | 208 | 201 | 184 | 204 | 192 | 192 |
| 2019 | 194 | 164 | 184 | 189 | 204 | 190 | 193 | 203 | 183 | 194 | 176 | 181 |
| 2020 | 189 | 185 | 174 | 124 | 152 | 163 | 169 | 164 | 153 | 153 | 133 | 138 |
| 2021 | 141 | 139 | 172 | 176 | 170 | 173 | 169 | 166 | 158 | 154 | 146 | 165 |
| 2022 | 142 | 143 | 169 | 145 | 156 | 155 | 165 | 162 | 160 | 167 | 161 | 156 |
| 2023 | 169 | 164 | 177 | 149 | 168 | 175 | 180 | 183 | 172 | 173 | 181 | 176 |
| 2024 | 157 | 175 | 203 | 182 | 191 | 183 | ||||||
| - = No Data Reported; -- = Not Applicable; NA = Not Available; W = Withheld to avoid disclosure of individual company data. |
| Release Date: 8/30/2024 |
| Next Release Date: 9/30/2024 |