|
Download Data (XLS File) |
|
||||||||
|
||||||||
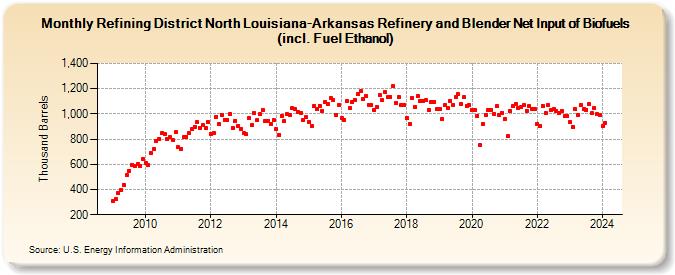
| Refining District North Louisiana-Arkansas Refinery and Blender Net Input of Biofuels (incl. Fuel Ethanol) (Thousand Barrels) | ||||||||
| Year | Jan | Feb | Mar | Apr | May | Jun | Jul | Aug | Sep | Oct | Nov | Dec |
|---|---|---|---|---|---|---|---|---|---|---|---|---|
| 2009 | 312 | 322 | 369 | 400 | 437 | 513 | 549 | 596 | 587 | 603 | 590 | 642 |
| 2010 | 614 | 593 | 691 | 725 | 783 | 802 | 845 | 841 | 799 | 816 | 790 | 855 |
| 2011 | 734 | 723 | 816 | 817 | 848 | 882 | 898 | 934 | 891 | 910 | 885 | 935 |
| 2012 | 843 | 849 | 976 | 917 | 994 | 955 | 955 | 1,000 | 889 | 944 | 905 | 883 |
| 2013 | 845 | 837 | 966 | 908 | 1,007 | 949 | 997 | 1,032 | 941 | 947 | 918 | 950 |
| 2014 | 877 | 835 | 986 | 944 | 996 | 994 | 1,044 | 1,035 | 1,015 | 1,009 | 949 | 975 |
| 2015 | 937 | 906 | 1,063 | 1,038 | 1,065 | 1,026 | 1,094 | 1,078 | 1,125 | 1,108 | 994 | 1,071 |
| 2016 | 969 | 953 | 1,103 | 1,047 | 1,093 | 1,114 | 1,159 | 1,179 | 1,121 | 1,143 | 1,073 | 1,070 |
| 2017 | 1,033 | 1,051 | 1,151 | 1,108 | 1,176 | 1,132 | 1,136 | 1,218 | 1,087 | 1,133 | 1,072 | 1,068 |
| 2018 | 966 | 923 | 1,126 | 1,057 | 1,141 | 1,106 | 1,099 | 1,110 | 1,030 | 1,097 | 1,095 | 1,036 |
| 2019 | 1,036 | 958 | 1,068 | 1,049 | 1,102 | 1,073 | 1,132 | 1,154 | 1,079 | 1,132 | 1,064 | 1,069 |
| 2020 | 1,027 | 1,030 | 984 | 752 | 921 | 994 | 1,033 | 1,032 | 1,003 | 1,059 | 988 | 1,010 |
| 2021 | 956 | 822 | 1,023 | 1,061 | 1,080 | 1,049 | 1,054 | 1,068 | 1,025 | 1,060 | 1,038 | 1,036 |
| 2022 | 921 | 903 | 1,065 | 1,008 | 1,072 | 1,028 | 1,035 | 1,022 | 1,008 | 1,024 | 983 | 981 |
| 2023 | 936 | 898 | 1,036 | 993 | 1,071 | 1,035 | 1,034 | 1,077 | 1,004 | 1,046 | 999 | 990 |
| 2024 | 902 | 926 | ||||||||||
| - = No Data Reported; -- = Not Applicable; NA = Not Available; W = Withheld to avoid disclosure of individual company data. |
| Release Date: 4/30/2024 |
| Next Release Date: 5/31/2024 |