|
Download Data (XLS File) |
|
||||||||
|
||||||||
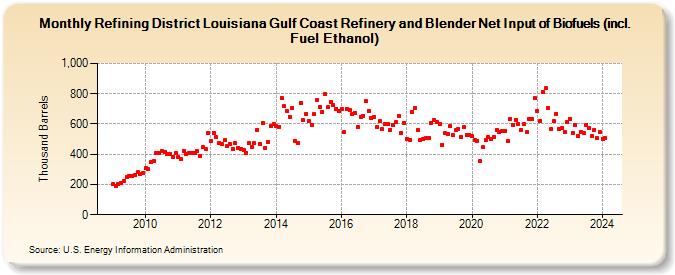
| Refining District Louisiana Gulf Coast Refinery and Blender Net Input of Biofuels (incl. Fuel Ethanol) (Thousand Barrels) | ||||||||
| Year | Jan | Feb | Mar | Apr | May | Jun | Jul | Aug | Sep | Oct | Nov | Dec |
|---|---|---|---|---|---|---|---|---|---|---|---|---|
| 2009 | 201 | 187 | 200 | 207 | 224 | 251 | 254 | 254 | 262 | 280 | 266 | 275 |
| 2010 | 307 | 300 | 349 | 355 | 411 | 410 | 421 | 415 | 402 | 401 | 384 | 409 |
| 2011 | 382 | 369 | 423 | 403 | 411 | 407 | 410 | 419 | 389 | 445 | 433 | 541 |
| 2012 | 490 | 542 | 513 | 473 | 467 | 494 | 452 | 467 | 434 | 471 | 442 | 437 |
| 2013 | 427 | 411 | 472 | 451 | 471 | 559 | 469 | 608 | 442 | 484 | 588 | 600 |
| 2014 | 585 | 582 | 775 | 717 | 685 | 649 | 707 | 485 | 477 | 738 | 623 | 669 |
| 2015 | 620 | 592 | 663 | 756 | 712 | 681 | 797 | 709 | 747 | 725 | 702 | 685 |
| 2016 | 698 | 544 | 701 | 692 | 667 | 674 | 582 | 648 | 656 | 750 | 689 | 637 |
| 2017 | 648 | 583 | 618 | 566 | 600 | 598 | 562 | 591 | 610 | 651 | 539 | 606 |
| 2018 | 499 | 494 | 679 | 706 | 559 | 494 | 502 | 505 | 504 | 609 | 626 | 612 |
| 2019 | 599 | 464 | 540 | 533 | 585 | 524 | 560 | 566 | 515 | 577 | 524 | 528 |
| 2020 | 518 | 492 | 487 | 354 | 445 | 492 | 511 | 502 | 517 | 563 | 545 | 551 |
| 2021 | 553 | 486 | 631 | 594 | 629 | 600 | 560 | 598 | 544 | 636 | 635 | 770 |
| 2022 | 683 | 620 | 814 | 835 | 704 | 565 | 618 | 665 | 568 | 572 | 548 | 616 |
| 2023 | 633 | 539 | 593 | 519 | 549 | 538 | 596 | 575 | 523 | 563 | 504 | 545 |
| 2024 | 502 | 504 | ||||||||||
| - = No Data Reported; -- = Not Applicable; NA = Not Available; W = Withheld to avoid disclosure of individual company data. |
| Release Date: 4/30/2024 |
| Next Release Date: 5/31/2024 |