|
Download Data (XLS File) |
|
||||||||
|
||||||||
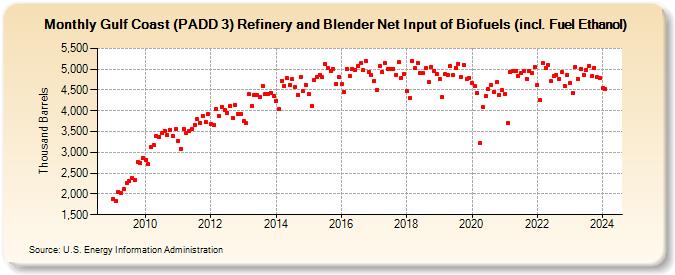
| Gulf Coast (PADD 3) Refinery and Blender Net Input of Biofuels (incl. Fuel Ethanol) (Thousand Barrels) | ||||||||
| Year | Jan | Feb | Mar | Apr | May | Jun | Jul | Aug | Sep | Oct | Nov | Dec |
|---|---|---|---|---|---|---|---|---|---|---|---|---|
| 2009 | 1,878 | 1,838 | 2,053 | 2,018 | 2,107 | 2,259 | 2,310 | 2,381 | 2,337 | 2,771 | 2,742 | 2,854 |
| 2010 | 2,817 | 2,715 | 3,138 | 3,178 | 3,391 | 3,381 | 3,471 | 3,524 | 3,410 | 3,542 | 3,405 | 3,563 |
| 2011 | 3,277 | 3,087 | 3,571 | 3,467 | 3,525 | 3,562 | 3,661 | 3,792 | 3,713 | 3,884 | 3,728 | 3,922 |
| 2012 | 3,680 | 3,652 | 4,053 | 3,872 | 4,087 | 4,014 | 3,953 | 4,110 | 3,830 | 4,134 | 3,920 | 3,914 |
| 2013 | 3,751 | 3,699 | 4,396 | 4,118 | 4,377 | 4,384 | 4,330 | 4,600 | 4,392 | 4,414 | 4,439 | 4,362 |
| 2014 | 4,235 | 4,037 | 4,727 | 4,602 | 4,787 | 4,615 | 4,754 | 4,582 | 4,389 | 4,802 | 4,472 | 4,623 |
| 2015 | 4,402 | 4,120 | 4,732 | 4,815 | 4,872 | 4,807 | 5,127 | 5,038 | 4,967 | 4,994 | 4,642 | 4,803 |
| 2016 | 4,636 | 4,445 | 4,994 | 4,826 | 5,005 | 4,985 | 5,071 | 5,139 | 4,978 | 5,194 | 4,933 | 4,858 |
| 2017 | 4,712 | 4,507 | 5,080 | 4,923 | 5,157 | 5,000 | 4,999 | 5,014 | 4,869 | 5,164 | 4,794 | 4,883 |
| 2018 | 4,470 | 4,312 | 5,194 | 5,028 | 5,153 | 4,904 | 4,906 | 5,033 | 4,692 | 5,060 | 4,964 | 4,890 |
| 2019 | 4,763 | 4,320 | 4,873 | 4,852 | 5,065 | 4,868 | 5,029 | 5,128 | 4,814 | 5,103 | 4,763 | 4,794 |
| 2020 | 4,662 | 4,591 | 4,427 | 3,224 | 4,084 | 4,352 | 4,517 | 4,626 | 4,461 | 4,680 | 4,380 | 4,489 |
| 2021 | 4,398 | 3,710 | 4,941 | 4,949 | 4,959 | 4,840 | 4,903 | 4,962 | 4,764 | 4,961 | 4,920 | 5,052 |
| 2022 | 4,617 | 4,248 | 5,145 | 5,033 | 5,101 | 4,706 | 4,840 | 4,860 | 4,765 | 4,924 | 4,604 | 4,855 |
| 2023 | 4,663 | 4,417 | 5,063 | 4,762 | 5,009 | 4,855 | 4,991 | 5,065 | 4,831 | 5,039 | 4,804 | 4,793 |
| 2024 | 4,542 | |||||||||||
| - = No Data Reported; -- = Not Applicable; NA = Not Available; W = Withheld to avoid disclosure of individual company data. |
| Release Date: 3/29/2024 |
| Next Release Date: 4/30/2024 |