|
Download Data (XLS File) |
|
||||||||
|
||||||||
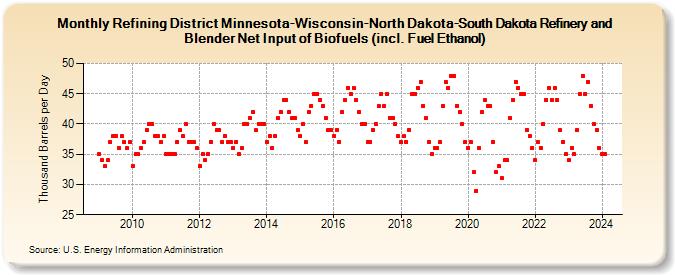
| Refining District Minnesota-Wisconsin-North Dakota-South Dakota Refinery and Blender Net Input of Biofuels (incl. Fuel Ethanol) (Thousand Barrels per Day) | ||||||||
| Year | Jan | Feb | Mar | Apr | May | Jun | Jul | Aug | Sep | Oct | Nov | Dec |
|---|---|---|---|---|---|---|---|---|---|---|---|---|
| 2009 | 35 | 34 | 33 | 34 | 37 | 38 | 38 | 36 | 38 | 37 | 36 | 37 |
| 2010 | 33 | 35 | 35 | 36 | 37 | 39 | 40 | 40 | 38 | 38 | 37 | 38 |
| 2011 | 35 | 35 | 35 | 35 | 37 | 39 | 38 | 40 | 37 | 37 | 37 | 36 |
| 2012 | 33 | 35 | 34 | 35 | 37 | 40 | 39 | 39 | 37 | 38 | 37 | 37 |
| 2013 | 36 | 37 | 35 | 36 | 40 | 40 | 41 | 42 | 39 | 40 | 40 | 40 |
| 2014 | 37 | 38 | 36 | 38 | 41 | 42 | 44 | 44 | 42 | 41 | 41 | 39 |
| 2015 | 38 | 40 | 37 | 42 | 43 | 45 | 45 | 44 | 43 | 41 | 39 | 39 |
| 2016 | 38 | 39 | 37 | 42 | 44 | 46 | 45 | 46 | 44 | 42 | 40 | 40 |
| 2017 | 37 | 37 | 39 | 40 | 43 | 45 | 43 | 45 | 41 | 41 | 40 | 38 |
| 2018 | 37 | 38 | 37 | 39 | 45 | 45 | 46 | 47 | 43 | 41 | 37 | 35 |
| 2019 | 36 | 36 | 37 | 43 | 47 | 46 | 48 | 48 | 43 | 42 | 40 | 37 |
| 2020 | 36 | 37 | 32 | 29 | 36 | 42 | 44 | 43 | 43 | 37 | 32 | 33 |
| 2021 | 31 | 34 | 34 | 41 | 44 | 47 | 46 | 45 | 45 | 39 | 38 | 36 |
| 2022 | 34 | 37 | 36 | 40 | 44 | 46 | 44 | 46 | 44 | 39 | 37 | 35 |
| 2023 | 34 | 36 | 35 | 39 | 45 | 48 | 45 | 47 | 43 | 40 | 39 | 36 |
| 2024 | 35 | |||||||||||
| - = No Data Reported; -- = Not Applicable; NA = Not Available; W = Withheld to avoid disclosure of individual company data. |
| Release Date: 3/29/2024 |
| Next Release Date: 4/30/2024 |