|
Download Data (XLS File) |
|
||||||||
|
||||||||
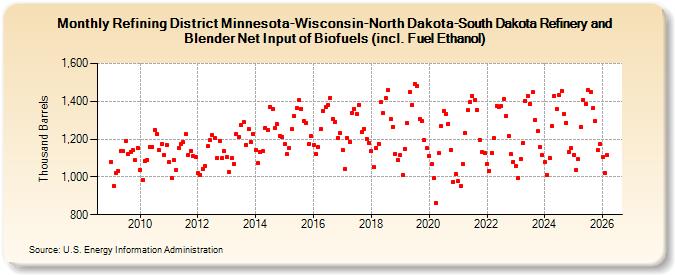
| Refining District Minnesota-Wisconsin-North Dakota-South Dakota Refinery and Blender Net Input of Biofuels (incl. Fuel Ethanol) (Thousand Barrels) | ||||||||
| Year | Jan | Feb | Mar | Apr | May | Jun | Jul | Aug | Sep | Oct | Nov | Dec |
|---|---|---|---|---|---|---|---|---|---|---|---|---|
| 2009 | 1,079 | 953 | 1,023 | 1,032 | 1,138 | 1,137 | 1,190 | 1,121 | 1,132 | 1,140 | 1,088 | 1,155 |
| 2010 | 1,038 | 986 | 1,082 | 1,091 | 1,156 | 1,157 | 1,249 | 1,226 | 1,143 | 1,172 | 1,116 | 1,169 |
| 2011 | 1,078 | 992 | 1,091 | 1,038 | 1,155 | 1,173 | 1,183 | 1,225 | 1,117 | 1,139 | 1,110 | 1,106 |
| 2012 | 1,019 | 1,010 | 1,044 | 1,058 | 1,162 | 1,193 | 1,220 | 1,206 | 1,101 | 1,191 | 1,102 | 1,135 |
| 2013 | 1,103 | 1,024 | 1,098 | 1,070 | 1,227 | 1,212 | 1,275 | 1,291 | 1,169 | 1,254 | 1,186 | 1,227 |
| 2014 | 1,144 | 1,071 | 1,130 | 1,135 | 1,259 | 1,250 | 1,372 | 1,357 | 1,257 | 1,278 | 1,218 | 1,213 |
| 2015 | 1,172 | 1,119 | 1,154 | 1,254 | 1,321 | 1,364 | 1,405 | 1,361 | 1,297 | 1,284 | 1,173 | 1,215 |
| 2016 | 1,169 | 1,120 | 1,159 | 1,253 | 1,350 | 1,370 | 1,381 | 1,420 | 1,307 | 1,292 | 1,207 | 1,231 |
| 2017 | 1,141 | 1,044 | 1,205 | 1,185 | 1,340 | 1,359 | 1,335 | 1,382 | 1,236 | 1,256 | 1,202 | 1,181 |
| 2018 | 1,137 | 1,050 | 1,155 | 1,175 | 1,396 | 1,338 | 1,416 | 1,458 | 1,304 | 1,264 | 1,122 | 1,091 |
| 2019 | 1,114 | 1,010 | 1,149 | 1,283 | 1,448 | 1,383 | 1,493 | 1,481 | 1,304 | 1,296 | 1,196 | 1,151 |
| 2020 | 1,113 | 1,067 | 992 | 863 | 1,125 | 1,271 | 1,349 | 1,335 | 1,282 | 1,141 | 974 | 1,015 |
| 2021 | 976 | 950 | 1,066 | 1,232 | 1,352 | 1,397 | 1,429 | 1,409 | 1,354 | 1,197 | 1,132 | 1,126 |
| 2022 | 1,068 | 1,033 | 1,129 | 1,204 | 1,377 | 1,372 | 1,375 | 1,411 | 1,323 | 1,218 | 1,119 | 1,080 |
| 2023 | 1,059 | 994 | 1,094 | 1,179 | 1,404 | 1,427 | 1,386 | 1,447 | 1,303 | 1,242 | 1,159 | 1,116 |
| 2024 | 1,078 | |||||||||||
| - = No Data Reported; -- = Not Applicable; NA = Not Available; W = Withheld to avoid disclosure of individual company data. |
| Release Date: 3/29/2024 |
| Next Release Date: 4/30/2024 |