|
Download Data (XLS File) |
|
||||||||
|
||||||||
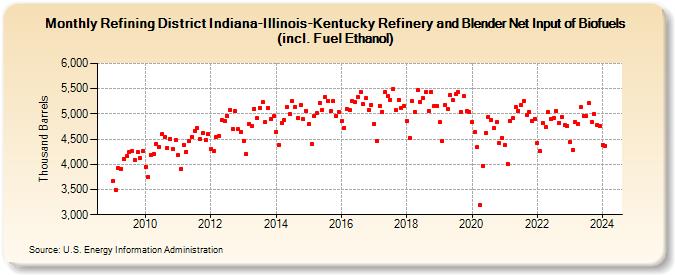
| Refining District Indiana-Illinois-Kentucky Refinery and Blender Net Input of Biofuels (incl. Fuel Ethanol) (Thousand Barrels) | ||||||||
| Year | Jan | Feb | Mar | Apr | May | Jun | Jul | Aug | Sep | Oct | Nov | Dec |
|---|---|---|---|---|---|---|---|---|---|---|---|---|
| 2009 | 3,659 | 3,497 | 3,917 | 3,914 | 4,096 | 4,159 | 4,237 | 4,257 | 4,094 | 4,237 | 4,123 | 4,268 |
| 2010 | 3,948 | 3,744 | 4,194 | 4,213 | 4,399 | 4,352 | 4,595 | 4,547 | 4,321 | 4,496 | 4,304 | 4,475 |
| 2011 | 4,184 | 3,909 | 4,392 | 4,253 | 4,454 | 4,541 | 4,669 | 4,720 | 4,499 | 4,618 | 4,483 | 4,594 |
| 2012 | 4,310 | 4,269 | 4,534 | 4,569 | 4,888 | 4,857 | 4,961 | 5,087 | 4,698 | 5,055 | 4,692 | 4,631 |
| 2013 | 4,467 | 4,200 | 4,799 | 4,753 | 5,103 | 4,911 | 5,116 | 5,229 | 4,832 | 5,110 | 4,896 | 4,952 |
| 2014 | 4,632 | 4,385 | 4,822 | 4,879 | 5,140 | 4,995 | 5,250 | 5,144 | 4,923 | 5,173 | 4,889 | 5,065 |
| 2015 | 4,801 | 4,409 | 4,955 | 5,008 | 5,220 | 5,083 | 5,340 | 5,264 | 5,051 | 5,252 | 4,968 | 5,044 |
| 2016 | 4,855 | 4,724 | 5,094 | 5,081 | 5,250 | 5,229 | 5,344 | 5,433 | 5,189 | 5,308 | 5,076 | 5,185 |
| 2017 | 4,804 | 4,465 | 5,164 | 5,046 | 5,427 | 5,351 | 5,279 | 5,503 | 5,073 | 5,282 | 5,118 | 5,154 |
| 2018 | 4,856 | 4,531 | 5,248 | 5,046 | 5,466 | 5,242 | 5,311 | 5,433 | 5,063 | 5,439 | 5,147 | 5,161 |
| 2019 | 4,833 | 4,463 | 5,173 | 5,101 | 5,384 | 5,267 | 5,385 | 5,431 | 5,035 | 5,354 | 5,054 | 5,041 |
| 2020 | 4,841 | 4,635 | 4,336 | 3,194 | 3,968 | 4,623 | 4,945 | 4,870 | 4,719 | 4,833 | 4,424 | 4,522 |
| 2021 | 4,385 | 4,011 | 4,865 | 4,911 | 5,138 | 5,064 | 5,181 | 5,263 | 4,978 | 5,038 | 4,855 | 4,900 |
| 2022 | 4,419 | 4,255 | 4,818 | 4,733 | 5,034 | 4,895 | 4,925 | 5,057 | 4,823 | 4,946 | 4,774 | 4,764 |
| 2023 | 4,443 | 4,291 | 4,838 | 4,808 | 5,131 | 4,960 | 4,951 | 5,210 | 4,842 | 5,001 | 4,783 | 4,763 |
| 2024 | 4,391 | |||||||||||
| - = No Data Reported; -- = Not Applicable; NA = Not Available; W = Withheld to avoid disclosure of individual company data. |
| Release Date: 3/29/2024 |
| Next Release Date: 4/30/2024 |