|
Download Data (XLS File) |
|
||||||||
|
||||||||
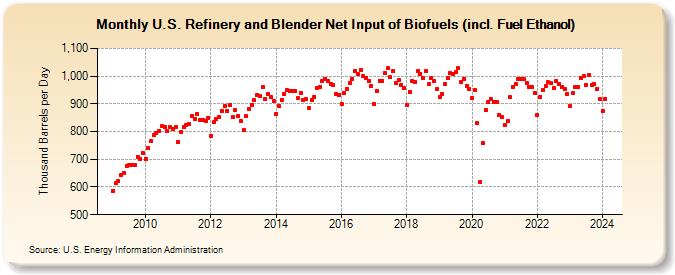
| U.S. Refinery and Blender Net Input of Biofuels (incl. Fuel Ethanol) (Thousand Barrels per Day) | ||||||||
| Year | Jan | Feb | Mar | Apr | May | Jun | Jul | Aug | Sep | Oct | Nov | Dec |
|---|---|---|---|---|---|---|---|---|---|---|---|---|
| 2009 | 586 | 614 | 620 | 645 | 650 | 676 | 680 | 681 | 679 | 710 | 702 | 724 |
| 2010 | 702 | 739 | 765 | 787 | 793 | 803 | 819 | 816 | 801 | 815 | 808 | 815 |
| 2011 | 763 | 798 | 817 | 824 | 826 | 855 | 847 | 864 | 843 | 842 | 839 | 849 |
| 2012 | 785 | 833 | 844 | 854 | 874 | 893 | 875 | 895 | 853 | 876 | 857 | 838 |
| 2013 | 806 | 855 | 882 | 894 | 914 | 932 | 930 | 959 | 919 | 935 | 924 | 910 |
| 2014 | 864 | 892 | 914 | 937 | 950 | 947 | 946 | 947 | 921 | 939 | 913 | 917 |
| 2015 | 884 | 913 | 926 | 958 | 961 | 983 | 989 | 984 | 972 | 969 | 936 | 933 |
| 2016 | 898 | 939 | 955 | 974 | 988 | 1,020 | 1,006 | 1,023 | 1,000 | 994 | 981 | 966 |
| 2017 | 901 | 946 | 984 | 984 | 1,013 | 1,029 | 995 | 1,017 | 976 | 985 | 969 | 956 |
| 2018 | 897 | 943 | 983 | 979 | 1,017 | 1,008 | 993 | 1,017 | 970 | 994 | 984 | 953 |
| 2019 | 923 | 935 | 970 | 993 | 1,010 | 1,009 | 1,014 | 1,028 | 978 | 990 | 965 | 953 |
| 2020 | 922 | 949 | 830 | 619 | 758 | 877 | 905 | 916 | 907 | 906 | 860 | 853 |
| 2021 | 825 | 838 | 923 | 962 | 972 | 991 | 988 | 988 | 976 | 962 | 959 | 940 |
| 2022 | 859 | 926 | 951 | 964 | 977 | 975 | 956 | 983 | 970 | 962 | 952 | 934 |
| 2023 | 891 | 938 | 962 | 961 | 993 | 999 | 969 | 1,004 | 969 | 972 | 955 | 916 |
| 2024 | 875 | |||||||||||
| - = No Data Reported; -- = Not Applicable; NA = Not Available; W = Withheld to avoid disclosure of individual company data. |
| Release Date: 3/29/2024 |
| Next Release Date: 4/30/2024 |