|
Download Data (XLS File) |
|
||||||||
|
||||||||
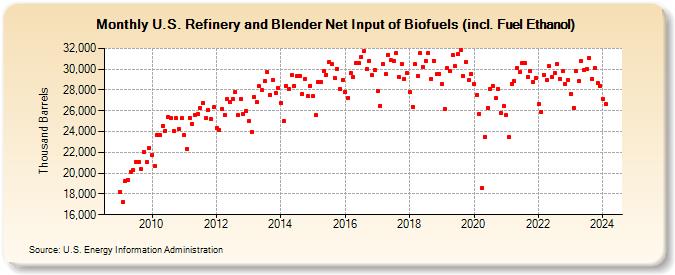
| U.S. Refinery and Blender Net Input of Biofuels (incl. Fuel Ethanol) (Thousand Barrels) | ||||||||
| Year | Jan | Feb | Mar | Apr | May | Jun | Jul | Aug | Sep | Oct | Nov | Dec |
|---|---|---|---|---|---|---|---|---|---|---|---|---|
| 2009 | 18,152 | 17,178 | 19,216 | 19,345 | 20,144 | 20,284 | 21,095 | 21,113 | 20,355 | 22,022 | 21,069 | 22,439 |
| 2010 | 21,756 | 20,682 | 23,713 | 23,624 | 24,569 | 24,098 | 25,397 | 25,281 | 24,028 | 25,274 | 24,225 | 25,278 |
| 2011 | 23,658 | 22,340 | 25,339 | 24,707 | 25,605 | 25,643 | 26,258 | 26,787 | 25,289 | 26,104 | 25,165 | 26,314 |
| 2012 | 24,342 | 24,161 | 26,156 | 25,621 | 27,105 | 26,798 | 27,138 | 27,758 | 25,589 | 27,154 | 25,723 | 25,964 |
| 2013 | 24,992 | 23,942 | 27,342 | 26,808 | 28,339 | 27,962 | 28,823 | 29,720 | 27,556 | 28,985 | 27,731 | 28,203 |
| 2014 | 26,772 | 24,983 | 28,347 | 28,117 | 29,444 | 28,403 | 29,317 | 29,354 | 27,637 | 29,100 | 27,387 | 28,423 |
| 2015 | 27,419 | 25,572 | 28,719 | 28,745 | 29,793 | 29,486 | 30,666 | 30,498 | 29,149 | 30,041 | 28,084 | 28,936 |
| 2016 | 27,827 | 27,233 | 29,608 | 29,220 | 30,614 | 30,608 | 31,178 | 31,718 | 30,005 | 30,815 | 29,420 | 29,941 |
| 2017 | 27,945 | 26,485 | 30,498 | 29,517 | 31,406 | 30,870 | 30,832 | 31,540 | 29,271 | 30,527 | 29,069 | 29,637 |
| 2018 | 27,804 | 26,398 | 30,469 | 29,374 | 31,527 | 30,230 | 30,768 | 31,535 | 29,087 | 30,814 | 29,529 | 29,557 |
| 2019 | 28,603 | 26,187 | 30,070 | 29,797 | 31,317 | 30,282 | 31,426 | 31,868 | 29,343 | 30,703 | 28,952 | 29,557 |
| 2020 | 28,597 | 27,534 | 25,734 | 18,570 | 23,512 | 26,301 | 28,058 | 28,410 | 27,219 | 28,088 | 25,795 | 26,450 |
| 2021 | 25,568 | 23,451 | 28,615 | 28,860 | 30,142 | 29,723 | 30,640 | 30,614 | 29,287 | 29,808 | 28,758 | 29,141 |
| 2022 | 26,631 | 25,916 | 29,484 | 28,921 | 30,278 | 29,245 | 29,633 | 30,486 | 29,090 | 29,818 | 28,545 | 28,964 |
| 2023 | 27,622 | 26,268 | 29,809 | 28,838 | 30,793 | 29,959 | 30,039 | 31,115 | 29,066 | 30,145 | 28,651 | 28,382 |
| 2024 | 27,116 | |||||||||||
| - = No Data Reported; -- = Not Applicable; NA = Not Available; W = Withheld to avoid disclosure of individual company data. |
| Release Date: 3/29/2024 |
| Next Release Date: 4/30/2024 |