|
Download Data (XLS File) |
|
||||||||
|
||||||||
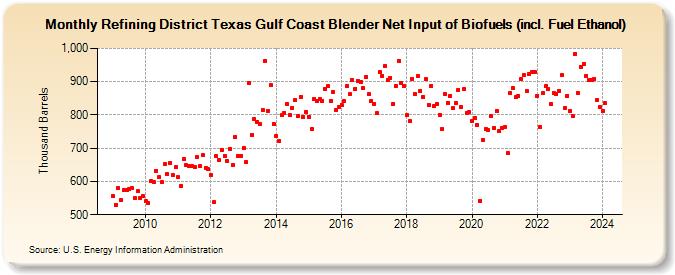
| Refining District Texas Gulf Coast Blender Net Input of Biofuels (incl. Fuel Ethanol) (Thousand Barrels) | ||||||||
| Year | Jan | Feb | Mar | Apr | May | Jun | Jul | Aug | Sep | Oct | Nov | Dec |
|---|---|---|---|---|---|---|---|---|---|---|---|---|
| 2009 | 556 | 530 | 580 | 544 | 573 | 573 | 577 | 580 | 550 | 570 | 551 | 555 |
| 2010 | 540 | 536 | 601 | 599 | 632 | 613 | 597 | 651 | 621 | 655 | 618 | 642 |
| 2011 | 612 | 587 | 667 | 649 | 647 | 645 | 643 | 672 | 646 | 679 | 641 | 637 |
| 2012 | 619 | 537 | 676 | 663 | 695 | 677 | 662 | 699 | 648 | 734 | 677 | 677 |
| 2013 | 702 | 658 | 896 | 741 | 787 | 779 | 772 | 815 | 962 | 813 | 889 | 772 |
| 2014 | 737 | 722 | 799 | 806 | 833 | 800 | 821 | 845 | 797 | 855 | 794 | 810 |
| 2015 | 794 | 757 | 848 | 842 | 848 | 843 | 879 | 886 | 843 | 869 | 815 | 825 |
| 2016 | 830 | 841 | 888 | 862 | 905 | 879 | 902 | 899 | 880 | 914 | 862 | 842 |
| 2017 | 834 | 805 | 929 | 917 | 947 | 906 | 911 | 834 | 887 | 963 | 897 | 888 |
| 2018 | 799 | 782 | 909 | 863 | 916 | 871 | 855 | 907 | 831 | 888 | 828 | 832 |
| 2019 | 801 | 758 | 862 | 836 | 858 | 820 | 836 | 876 | 824 | 878 | 806 | 808 |
| 2020 | 782 | 792 | 771 | 542 | 725 | 757 | 754 | 797 | 762 | 813 | 752 | 760 |
| 2021 | 765 | 686 | 866 | 880 | 853 | 857 | 908 | 919 | 872 | 924 | 928 | 929 |
| 2022 | 858 | 763 | 865 | 886 | 878 | 833 | 867 | 864 | 873 | 920 | 821 | 858 |
| 2023 | 812 | 797 | 984 | 866 | 945 | 954 | 918 | 906 | 905 | 909 | 845 | 823 |
| 2024 | 811 | |||||||||||
| - = No Data Reported; -- = Not Applicable; NA = Not Available; W = Withheld to avoid disclosure of individual company data. |
| Release Date: 3/29/2024 |
| Next Release Date: 4/30/2024 |