|
Download Data (XLS File) |
|
||||||||
|
||||||||
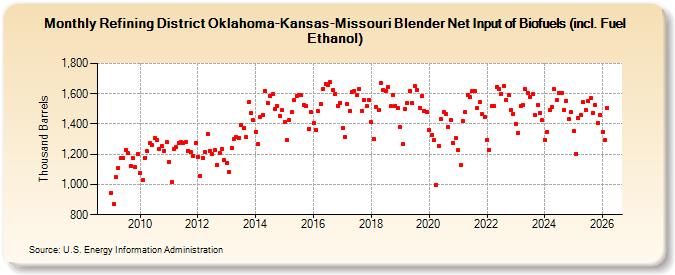
| Refining District Oklahoma-Kansas-Missouri Blender Net Input of Biofuels (incl. Fuel Ethanol) (Thousand Barrels) | ||||||||
| Year | Jan | Feb | Mar | Apr | May | Jun | Jul | Aug | Sep | Oct | Nov | Dec |
|---|---|---|---|---|---|---|---|---|---|---|---|---|
| 2009 | 946 | 869 | 1,047 | 1,110 | 1,174 | 1,176 | 1,230 | 1,205 | 1,125 | 1,174 | 1,115 | 1,204 |
| 2010 | 1,079 | 1,027 | 1,177 | 1,218 | 1,272 | 1,259 | 1,307 | 1,297 | 1,234 | 1,252 | 1,220 | 1,280 |
| 2011 | 1,150 | 1,014 | 1,237 | 1,246 | 1,274 | 1,282 | 1,275 | 1,281 | 1,222 | 1,212 | 1,185 | 1,274 |
| 2012 | 1,184 | 1,055 | 1,177 | 1,214 | 1,334 | 1,224 | 1,200 | 1,228 | 1,129 | 1,206 | 1,233 | 1,160 |
| 2013 | 1,145 | 1,085 | 1,241 | 1,303 | 1,313 | 1,304 | 1,392 | 1,374 | 1,311 | 1,542 | 1,471 | 1,423 |
| 2014 | 1,350 | 1,267 | 1,448 | 1,462 | 1,617 | 1,539 | 1,583 | 1,596 | 1,496 | 1,518 | 1,454 | 1,490 |
| 2015 | 1,416 | 1,293 | 1,429 | 1,477 | 1,558 | 1,585 | 1,594 | 1,592 | 1,524 | 1,520 | 1,368 | 1,476 |
| 2016 | 1,404 | 1,361 | 1,483 | 1,532 | 1,634 | 1,667 | 1,655 | 1,677 | 1,622 | 1,601 | 1,521 | 1,541 |
| 2017 | 1,372 | 1,316 | 1,534 | 1,484 | 1,609 | 1,620 | 1,593 | 1,634 | 1,488 | 1,561 | 1,518 | 1,560 |
| 2018 | 1,411 | 1,301 | 1,513 | 1,490 | 1,672 | 1,625 | 1,621 | 1,645 | 1,516 | 1,589 | 1,522 | 1,503 |
| 2019 | 1,378 | 1,267 | 1,502 | 1,539 | 1,618 | 1,540 | 1,649 | 1,624 | 1,508 | 1,584 | 1,488 | 1,478 |
| 2020 | 1,362 | 1,330 | 1,295 | 999 | 1,256 | 1,430 | 1,477 | 1,465 | 1,377 | 1,429 | 1,275 | 1,308 |
| 2021 | 1,227 | 1,126 | 1,422 | 1,477 | 1,591 | 1,578 | 1,618 | 1,617 | 1,506 | 1,543 | 1,464 | 1,446 |
| 2022 | 1,295 | 1,231 | 1,516 | 1,516 | 1,647 | 1,630 | 1,600 | 1,651 | 1,561 | 1,592 | 1,493 | 1,469 |
| 2023 | 1,399 | 1,338 | 1,520 | 1,524 | 1,628 | 1,607 | 1,580 | 1,597 | 1,459 | 1,525 | 1,475 | 1,424 |
| 2024 | 1,295 | |||||||||||
| - = No Data Reported; -- = Not Applicable; NA = Not Available; W = Withheld to avoid disclosure of individual company data. |
| Release Date: 3/29/2024 |
| Next Release Date: 4/30/2024 |