|
Download Data (XLS File) |
|
||||||||
|
||||||||
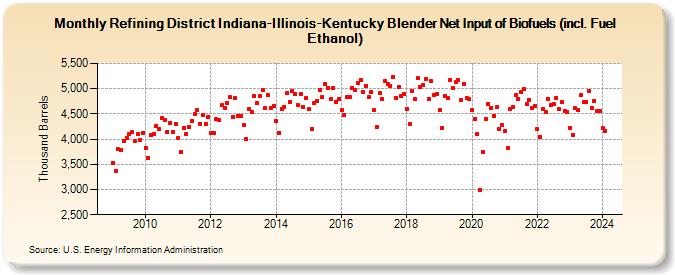
| Refining District Indiana-Illinois-Kentucky Blender Net Input of Biofuels (incl. Fuel Ethanol) (Thousand Barrels) | ||||||||
| Year | Jan | Feb | Mar | Apr | May | Jun | Jul | Aug | Sep | Oct | Nov | Dec |
|---|---|---|---|---|---|---|---|---|---|---|---|---|
| 2009 | 3,526 | 3,376 | 3,797 | 3,788 | 3,970 | 4,025 | 4,100 | 4,138 | 3,964 | 4,098 | 3,987 | 4,124 |
| 2010 | 3,826 | 3,617 | 4,077 | 4,093 | 4,263 | 4,192 | 4,412 | 4,374 | 4,147 | 4,311 | 4,140 | 4,306 |
| 2011 | 4,015 | 3,747 | 4,227 | 4,102 | 4,245 | 4,355 | 4,490 | 4,572 | 4,306 | 4,472 | 4,298 | 4,437 |
| 2012 | 4,117 | 4,112 | 4,397 | 4,378 | 4,672 | 4,619 | 4,721 | 4,832 | 4,443 | 4,820 | 4,454 | 4,463 |
| 2013 | 4,274 | 3,995 | 4,594 | 4,529 | 4,850 | 4,716 | 4,847 | 4,975 | 4,616 | 4,865 | 4,625 | 4,666 |
| 2014 | 4,356 | 4,129 | 4,604 | 4,638 | 4,914 | 4,738 | 4,964 | 4,898 | 4,676 | 4,904 | 4,631 | 4,812 |
| 2015 | 4,593 | 4,209 | 4,720 | 4,753 | 4,973 | 4,837 | 5,094 | 5,017 | 4,798 | 5,009 | 4,738 | 4,798 |
| 2016 | 4,582 | 4,477 | 4,829 | 4,829 | 5,012 | 4,981 | 5,114 | 5,170 | 4,939 | 5,063 | 4,826 | 4,933 |
| 2017 | 4,573 | 4,244 | 4,911 | 4,791 | 5,151 | 5,091 | 5,061 | 5,233 | 4,824 | 5,035 | 4,852 | 4,896 |
| 2018 | 4,598 | 4,294 | 4,954 | 4,786 | 5,204 | 5,026 | 5,083 | 5,191 | 4,804 | 5,149 | 4,881 | 4,889 |
| 2019 | 4,572 | 4,225 | 4,853 | 4,822 | 5,163 | 5,017 | 5,133 | 5,166 | 4,770 | 5,098 | 4,809 | 4,787 |
| 2020 | 4,583 | 4,406 | 4,098 | 2,991 | 3,741 | 4,392 | 4,706 | 4,623 | 4,465 | 4,628 | 4,196 | 4,287 |
| 2021 | 4,154 | 3,824 | 4,605 | 4,638 | 4,874 | 4,801 | 4,935 | 4,993 | 4,697 | 4,778 | 4,624 | 4,658 |
| 2022 | 4,198 | 4,040 | 4,599 | 4,535 | 4,801 | 4,680 | 4,689 | 4,824 | 4,591 | 4,731 | 4,549 | 4,543 |
| 2023 | 4,230 | 4,086 | 4,607 | 4,573 | 4,882 | 4,726 | 4,733 | 4,964 | 4,618 | 4,763 | 4,565 | 4,548 |
| 2024 | 4,214 | 4,168 | ||||||||||
| - = No Data Reported; -- = Not Applicable; NA = Not Available; W = Withheld to avoid disclosure of individual company data. |
| Release Date: 4/30/2024 |
| Next Release Date: 5/31/2024 |