|
Download Data (XLS File) |
|
||||||||
|
||||||||
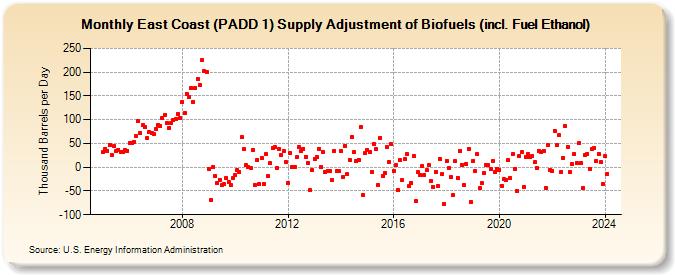
| East Coast (PADD 1) Supply Adjustment of Biofuels (incl. Fuel Ethanol) (Thousand Barrels per Day) | ||||||||
| Year | Jan | Feb | Mar | Apr | May | Jun | Jul | Aug | Sep | Oct | Nov | Dec |
|---|---|---|---|---|---|---|---|---|---|---|---|---|
| 2005 | 31 | 39 | 35 | 46 | 25 | 44 | 35 | 37 | 32 | 32 | 37 | 35 |
| 2006 | 51 | 51 | 54 | 65 | 97 | 72 | 88 | 85 | 61 | 74 | 73 | 70 |
| 2007 | 81 | 89 | 87 | 104 | 109 | 92 | 83 | 92 | 100 | 101 | 112 | 104 |
| 2008 | 137 | 115 | 155 | 148 | 167 | 137 | 167 | 186 | 172 | 225 | 202 | 201 |
| 2009 | -4 | -68 | 0 | -19 | -34 | -26 | -37 | -36 | -23 | -31 | -38 | -23 |
| 2010 | -17 | -6 | -10 | 63 | 38 | 4 | 0 | -2 | 37 | -37 | 16 | -35 |
| 2011 | 20 | -36 | 27 | -19 | 8 | 40 | 43 | -2 | 38 | 26 | 34 | 10 |
| 2012 | -33 | 29 | 0 | 1 | 21 | 42 | 34 | 39 | 22 | 9 | -49 | -6 |
| 2013 | 18 | 21 | 39 | 1 | 32 | -11 | -8 | -8 | -28 | 34 | -9 | -9 |
| 2014 | 34 | -20 | 45 | -15 | 16 | 64 | 32 | 13 | 16 | 85 | -58 | 29 |
| 2015 | 36 | 33 | -10 | 49 | 38 | -38 | 62 | -18 | -12 | 42 | 10 | 48 |
| 2016 | -8 | 5 | -48 | 15 | -28 | 17 | 27 | -40 | -33 | 24 | -71 | -11 |
| 2017 | -16 | 3 | -16 | -6 | 4 | -30 | -41 | -10 | -39 | 18 | -14 | -78 |
| 2018 | 14 | -1 | -20 | -58 | 12 | -22 | 35 | 5 | -37 | 6 | 39 | -73 |
| 2019 | 14 | -8 | 28 | -44 | -34 | -13 | 4 | 4 | -3 | 12 | -10 | -3 |
| 2020 | -5 | -39 | -25 | -26 | 15 | -23 | 27 | -4 | -50 | 23 | 31 | -41 |
| 2021 | 21 | 28 | 21 | 24 | 10 | -1 | 34 | 31 | 35 | -43 | 46 | -5 |
| 2022 | -8 | 77 | 46 | 67 | -10 | 19 | 86 | 43 | -11 | 7 | 28 | 9 |
| 2023 | 50 | 8 | -44 | 26 | 28 | -4 | 38 | 40 | 13 | 28 | 11 | -34 |
| 2024 | 11 | |||||||||||
| - = No Data Reported; -- = Not Applicable; NA = Not Available; W = Withheld to avoid disclosure of individual company data. |
| Release Date: 3/29/2024 |
| Next Release Date: 4/30/2024 |