|
Download Data (XLS File) |
|
||||||||
|
||||||||
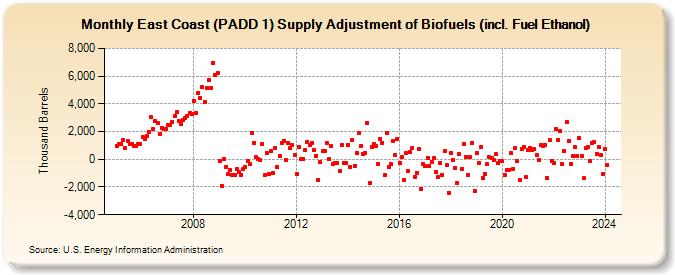
| East Coast (PADD 1) Supply Adjustment of Biofuels (incl. Fuel Ethanol) (Thousand Barrels) | ||||||||
| Year | Jan | Feb | Mar | Apr | May | Jun | Jul | Aug | Sep | Oct | Nov | Dec |
|---|---|---|---|---|---|---|---|---|---|---|---|---|
| 2005 | 974 | 1,095 | 1,080 | 1,394 | 779 | 1,321 | 1,097 | 1,133 | 959 | 984 | 1,121 | 1,076 |
| 2006 | 1,578 | 1,441 | 1,670 | 1,961 | 3,015 | 2,165 | 2,730 | 2,645 | 1,816 | 2,288 | 2,190 | 2,175 |
| 2007 | 2,503 | 2,483 | 2,698 | 3,113 | 3,383 | 2,768 | 2,579 | 2,867 | 2,987 | 3,142 | 3,363 | 3,239 |
| 2008 | 4,232 | 3,345 | 4,814 | 4,454 | 5,189 | 4,106 | 5,174 | 5,751 | 5,154 | 6,963 | 6,074 | 6,231 |
| 2009 | -121 | -1,899 | 1 | -578 | -1,060 | -772 | -1,142 | -1,127 | -700 | -954 | -1,132 | -722 |
| 2010 | -530 | -154 | -318 | 1,890 | 1,191 | 129 | 4 | -75 | 1,123 | -1,133 | 481 | -1,098 |
| 2011 | 615 | -1,017 | 849 | -577 | 246 | 1,190 | 1,324 | -54 | 1,142 | 811 | 1,014 | 301 |
| 2012 | -1,028 | 850 | -14 | 21 | 658 | 1,261 | 1,047 | 1,201 | 655 | 267 | -1,469 | -198 |
| 2013 | 562 | 580 | 1,201 | 32 | 991 | -315 | -233 | -247 | -836 | 1,062 | -265 | -293 |
| 2014 | 1,044 | -557 | 1,400 | -464 | 487 | 1,923 | 990 | 400 | 468 | 2,647 | -1,734 | 901 |
| 2015 | 1,116 | 926 | -311 | 1,471 | 1,181 | -1,147 | 1,914 | -547 | -348 | 1,310 | 291 | 1,486 |
| 2016 | -242 | 145 | -1,474 | 464 | -880 | 502 | 848 | -1,246 | -982 | 750 | -2,125 | -348 |
| 2017 | -499 | 77 | -499 | -166 | 126 | -902 | -1,276 | -300 | -1,168 | 566 | -414 | -2,408 |
| 2018 | 427 | -39 | -613 | -1,741 | 358 | -675 | 1,095 | 169 | -1,116 | 172 | 1,185 | -2,276 |
| 2019 | 435 | -233 | 882 | -1,335 | -1,068 | -376 | 132 | 119 | -85 | 363 | -290 | -93 |
| 2020 | -149 | -1,143 | -766 | -768 | 463 | -688 | 824 | -131 | -1,497 | 714 | 916 | -1,285 |
| 2021 | 646 | 789 | 646 | 706 | 313 | -35 | 1,039 | 954 | 1,053 | -1,347 | 1,385 | -160 |
| 2022 | -236 | 2,151 | 1,421 | 2,008 | -309 | 581 | 2,681 | 1,338 | -344 | 216 | 853 | 266 |
| 2023 | 1,550 | 237 | -1,371 | 789 | 867 | -135 | 1,171 | 1,230 | 399 | 862 | 323 | -1,066 |
| 2024 | 343 | |||||||||||
| - = No Data Reported; -- = Not Applicable; NA = Not Available; W = Withheld to avoid disclosure of individual company data. |
| Release Date: 3/29/2024 |
| Next Release Date: 4/30/2024 |