|
Download Data (XLS File) |
|
||||||||
|
||||||||
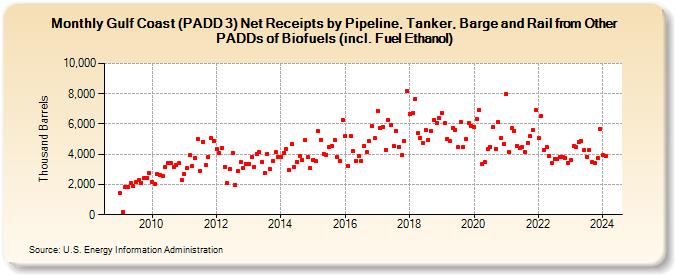
| Gulf Coast (PADD 3) Net Receipts by Pipeline, Tanker, Barge and Rail from Other PADDs of Biofuels (incl. Fuel Ethanol) (Thousand Barrels) | ||||||||
| Year | Jan | Feb | Mar | Apr | May | Jun | Jul | Aug | Sep | Oct | Nov | Dec |
|---|---|---|---|---|---|---|---|---|---|---|---|---|
| 2009 | 1,410 | 158 | 1,812 | 1,842 | 2,093 | 1,890 | 2,132 | 2,289 | 2,120 | 2,436 | 2,444 | 2,742 |
| 2010 | 2,132 | 2,052 | 2,675 | 2,618 | 2,568 | 3,143 | 3,439 | 3,433 | 3,126 | 3,266 | 3,403 | 2,291 |
| 2011 | 2,679 | 3,058 | 3,926 | 3,199 | 3,745 | 5,017 | 2,898 | 4,831 | 3,278 | 3,841 | 5,070 | 4,893 |
| 2012 | 4,326 | 4,109 | 4,427 | 3,174 | 2,067 | 3,040 | 4,091 | 1,990 | 2,894 | 3,482 | 3,094 | 3,374 |
| 2013 | 3,352 | 3,804 | 3,174 | 4,047 | 4,114 | 3,514 | 2,769 | 4,030 | 3,029 | 3,568 | 4,123 | 3,836 |
| 2014 | 3,833 | 4,091 | 4,359 | 2,929 | 4,688 | 3,161 | 3,503 | 3,915 | 3,620 | 4,930 | 3,791 | 3,086 |
| 2015 | 3,635 | 3,529 | 5,519 | 4,963 | 4,046 | 3,975 | 4,455 | 4,576 | 4,945 | 3,826 | 3,579 | 6,268 |
| 2016 | 5,206 | 3,228 | 5,221 | 4,202 | 3,584 | 3,878 | 3,555 | 4,570 | 4,141 | 4,850 | 5,840 | 5,044 |
| 2017 | 6,875 | 5,724 | 5,800 | 4,297 | 6,287 | 5,952 | 4,540 | 5,545 | 4,463 | 3,929 | 4,868 | 8,159 |
| 2018 | 6,679 | 6,705 | 7,644 | 5,374 | 5,077 | 4,765 | 5,619 | 4,970 | 5,535 | 6,261 | 6,088 | 6,372 |
| 2019 | 6,737 | 6,057 | 4,998 | 4,890 | 5,734 | 5,604 | 4,475 | 6,104 | 4,447 | 4,992 | 6,055 | 5,891 |
| 2020 | 5,780 | 6,311 | 6,945 | 3,328 | 3,456 | 4,346 | 4,494 | 5,790 | 4,341 | 6,107 | 5,075 | 4,674 |
| 2021 | 7,996 | 4,120 | 5,716 | 5,566 | 4,564 | 4,404 | 4,475 | 4,145 | 4,759 | 5,190 | 5,596 | 6,898 |
| 2022 | 5,057 | 6,535 | 4,261 | 4,488 | 3,850 | 3,389 | 3,678 | 3,671 | 3,831 | 3,832 | 3,760 | 3,439 |
| 2023 | 3,624 | 4,545 | 4,455 | 4,786 | 4,874 | 4,293 | 3,837 | 4,267 | 3,488 | 3,407 | 3,762 | 5,659 |
| 2024 | 3,953 | |||||||||||
| - = No Data Reported; -- = Not Applicable; NA = Not Available; W = Withheld to avoid disclosure of individual company data. |
| Release Date: 3/29/2024 |
| Next Release Date: 4/30/2024 |