|
Download Data (XLS File) |
|
||||||||
|
||||||||
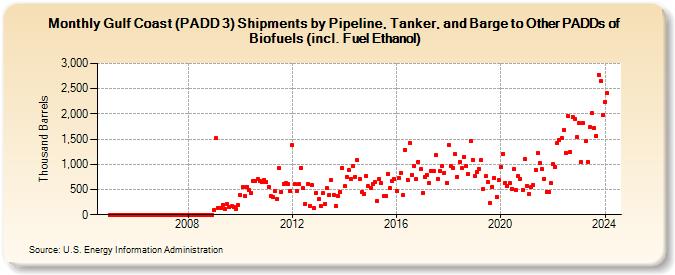
| Gulf Coast (PADD 3) Shipments by Pipeline, Tanker, and Barge to Other PADDs of Biofuels (incl. Fuel Ethanol) (Thousand Barrels) | ||||||||
| Year | Jan | Feb | Mar | Apr | May | Jun | Jul | Aug | Sep | Oct | Nov | Dec |
|---|---|---|---|---|---|---|---|---|---|---|---|---|
| 2005 | 0 | 0 | 0 | 0 | 0 | 0 | 0 | 0 | 0 | 0 | 0 | 0 |
| 2006 | 0 | 0 | 0 | 0 | 0 | 0 | 0 | 0 | 0 | 0 | 0 | 0 |
| 2007 | 0 | 0 | 0 | 0 | 0 | 0 | 0 | 0 | 0 | 0 | 0 | 0 |
| 2008 | 0 | 0 | 0 | 0 | 0 | 0 | 0 | 0 | 0 | 0 | 0 | 0 |
| 2009 | 101 | 1,512 | 132 | 126 | 201 | 116 | 209 | 148 | 167 | 146 | 117 | 183 |
| 2010 | 390 | 540 | 370 | 550 | 498 | 432 | 677 | 675 | 708 | 678 | 649 | 697 |
| 2011 | 647 | 552 | 370 | 349 | 461 | 314 | 923 | 446 | 616 | 624 | 609 | 462 |
| 2012 | 1,379 | 602 | 473 | 601 | 932 | 526 | 220 | 607 | 175 | 587 | 127 | 437 |
| 2013 | 302 | 182 | 423 | 215 | 523 | 392 | 688 | 392 | 176 | 381 | 451 | 929 |
| 2014 | 560 | 757 | 878 | 706 | 959 | 756 | 1,077 | 713 | 442 | 417 | 772 | 564 |
| 2015 | 537 | 607 | 642 | 273 | 704 | 625 | 372 | 365 | 815 | 522 | 660 | 708 |
| 2016 | 473 | 728 | 832 | 393 | 1,292 | 696 | 1,424 | 794 | 972 | 702 | 1,052 | 898 |
| 2017 | 432 | 756 | 797 | 627 | 872 | 863 | 1,181 | 711 | 875 | 963 | 836 | 636 |
| 2018 | 1,387 | 973 | 925 | 1,204 | 754 | 1,050 | 926 | 1,148 | 970 | 803 | 1,463 | 1,091 |
| 2019 | 768 | 844 | 915 | 1,084 | 503 | 759 | 640 | 235 | 559 | 724 | 355 | 688 |
| 2020 | 956 | 1,211 | 638 | 567 | 621 | 516 | 900 | 486 | 759 | 711 | 493 | 1,100 |
| 2021 | 579 | 411 | 543 | 591 | 892 | 1,229 | 1,029 | 909 | 714 | 454 | 455 | 629 |
| 2022 | 1,001 | 951 | 1,419 | 1,490 | 1,517 | 1,679 | 1,232 | 1,952 | 1,248 | 1,947 | 1,907 | 1,538 |
| 2023 | 1,822 | 1,037 | 1,810 | 1,455 | 1,046 | 1,731 | 2,017 | 1,720 | 1,558 | 2,780 | 2,657 | 1,986 |
| 2024 | 2,232 | |||||||||||
| - = No Data Reported; -- = Not Applicable; NA = Not Available; W = Withheld to avoid disclosure of individual company data. |
| Release Date: 3/29/2024 |
| Next Release Date: 4/30/2024 |
Referring Pages: