|
Download Data (XLS File) |
|
||||||||
|
||||||||
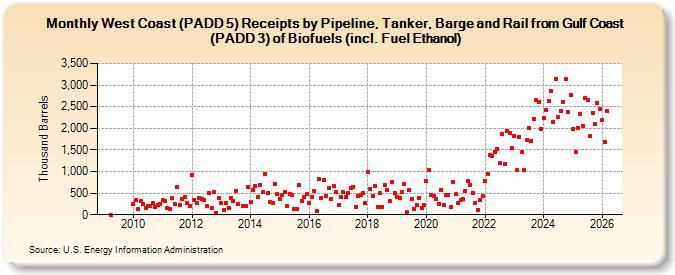
| West Coast (PADD 5) Receipts by Pipeline, Tanker, Barge and Rail from Gulf Coast (PADD 3) of Biofuels (incl. Fuel Ethanol) (Thousand Barrels) | ||||||||
| Year | Jan | Feb | Mar | Apr | May | Jun | Jul | Aug | Sep | Oct | Nov | Dec |
|---|---|---|---|---|---|---|---|---|---|---|---|---|
| 2009 | 4 | |||||||||||
| 2010 | 244 | 332 | 123 | 314 | 242 | 149 | 201 | 204 | 261 | 184 | 229 | 259 |
| 2011 | 337 | 309 | 156 | 126 | 388 | 240 | 635 | 229 | 371 | 419 | 262 | 191 |
| 2012 | 930 | 344 | 276 | 396 | 372 | 334 | 195 | 510 | 152 | 522 | 46 | 387 |
| 2013 | 277 | 120 | 269 | 163 | 395 | 310 | 545 | 249 | 199 | 212 | 645 | |
| 2014 | 289 | 570 | 657 | 419 | 680 | 524 | 949 | 507 | 297 | 264 | 712 | 469 |
| 2015 | 367 | 465 | 533 | 202 | 477 | 464 | 139 | 129 | 687 | 327 | 404 | 478 |
| 2016 | 278 | 421 | 552 | 90 | 823 | 392 | 802 | 433 | 608 | 361 | 675 | 521 |
| 2017 | 227 | 401 | 516 | 399 | 508 | 627 | 652 | 189 | 443 | 452 | 499 | 260 |
| 2018 | 998 | 588 | 430 | 674 | 186 | 501 | 183 | 691 | 582 | 309 | 766 | 508 |
| 2019 | 407 | 388 | 529 | 707 | 67 | 564 | 375 | 140 | 214 | 397 | 156 | 229 |
| 2020 | 774 | 1,030 | 456 | 437 | 354 | 257 | 581 | 221 | 457 | 445 | 181 | 763 |
| 2021 | 474 | 271 | 343 | 353 | 543 | 772 | 693 | 513 | 267 | 111 | 333 | 440 |
| 2022 | 775 | 945 | 1,386 | 1,350 | 1,459 | 1,528 | 1,187 | 1,859 | 1,168 | 1,947 | 1,892 | 1,538 |
| 2023 | 1,816 | 1,028 | 1,807 | 1,449 | 1,037 | 1,725 | 2,002 | 1,704 | 1,525 | 2,707 | 2,643 | 1,980 |
| 2024 | 2,232 | |||||||||||
| - = No Data Reported; -- = Not Applicable; NA = Not Available; W = Withheld to avoid disclosure of individual company data. |
| Release Date: 3/29/2024 |
| Next Release Date: 4/30/2024 |