|
Download Data (XLS File) |
|
||||||||
|
||||||||
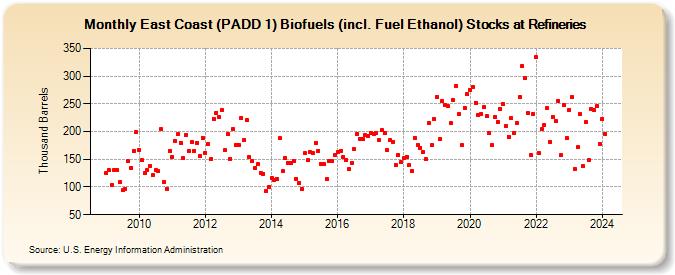
| East Coast (PADD 1) Biofuels (incl. Fuel Ethanol) Stocks at Refineries (Thousand Barrels) | ||||||||
| Year | Jan | Feb | Mar | Apr | May | Jun | Jul | Aug | Sep | Oct | Nov | Dec |
|---|---|---|---|---|---|---|---|---|---|---|---|---|
| 2009 | 126 | 130 | 104 | 130 | 130 | 109 | 94 | 97 | 146 | 135 | 165 | 199 |
| 2010 | 166 | 148 | 125 | 130 | 138 | 121 | 130 | 128 | 204 | 109 | 97 | 165 |
| 2011 | 154 | 183 | 195 | 180 | 152 | 194 | 165 | 181 | 165 | 180 | 156 | 189 |
| 2012 | 162 | 177 | 150 | 223 | 234 | 226 | 239 | 166 | 195 | 151 | 204 | 176 |
| 2013 | 175 | 225 | 185 | 220 | 154 | 147 | 135 | 141 | 125 | 124 | 93 | 100 |
| 2014 | 117 | 113 | 115 | 188 | 128 | 152 | 143 | 143 | 146 | 115 | 108 | 97 |
| 2015 | 161 | 148 | 163 | 161 | 180 | 165 | 142 | 141 | 114 | 146 | 146 | 157 |
| 2016 | 163 | 165 | 154 | 149 | 132 | 144 | 168 | 195 | 187 | 187 | 193 | 192 |
| 2017 | 197 | 196 | 198 | 184 | 202 | 197 | 166 | 185 | 182 | 140 | 158 | 145 |
| 2018 | 152 | 155 | 139 | 129 | 189 | 176 | 171 | 163 | 150 | 216 | 175 | 223 |
| 2019 | 263 | 186 | 255 | 247 | 246 | 215 | 257 | 283 | 231 | 175 | 243 | 267 |
| 2020 | 275 | 281 | 252 | 229 | 232 | 244 | 228 | 197 | 176 | 227 | 218 | 241 |
| 2021 | 250 | 210 | 191 | 224 | 198 | 216 | 262 | 318 | 296 | 234 | 158 | 232 |
| 2022 | 334 | 161 | 204 | 212 | 242 | 182 | 227 | 219 | 256 | 157 | 248 | 188 |
| 2023 | 239 | 262 | 133 | 172 | 231 | 137 | 217 | 148 | 241 | 238 | 246 | 178 |
| 2024 | 223 | |||||||||||
| - = No Data Reported; -- = Not Applicable; NA = Not Available; W = Withheld to avoid disclosure of individual company data. |
| Release Date: 3/29/2024 |
| Next Release Date: 4/30/2024 |