|
Download Data (XLS File) |
|
||||||||
|
||||||||
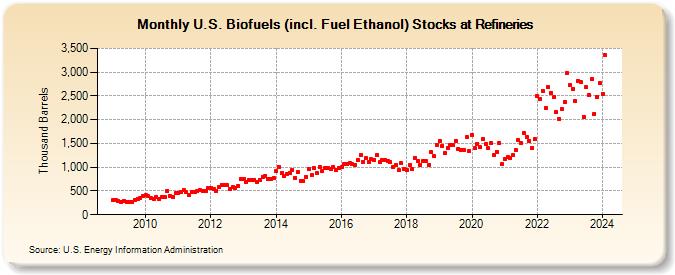
| U.S. Biofuels (incl. Fuel Ethanol) Stocks at Refineries (Thousand Barrels) | ||||||||
| Year | Jan | Feb | Mar | Apr | May | Jun | Jul | Aug | Sep | Oct | Nov | Dec |
|---|---|---|---|---|---|---|---|---|---|---|---|---|
| 2009 | 300 | 316 | 290 | 278 | 299 | 268 | 266 | 266 | 313 | 329 | 351 | 397 |
| 2010 | 407 | 387 | 343 | 339 | 370 | 331 | 377 | 381 | 500 | 403 | 382 | 454 |
| 2011 | 450 | 468 | 513 | 470 | 421 | 470 | 482 | 492 | 520 | 502 | 502 | 562 |
| 2012 | 560 | 533 | 509 | 586 | 631 | 621 | 622 | 538 | 575 | 552 | 614 | 750 |
| 2013 | 745 | 698 | 733 | 734 | 739 | 698 | 741 | 803 | 822 | 762 | 761 | 773 |
| 2014 | 915 | 1,010 | 874 | 823 | 864 | 885 | 946 | 779 | 896 | 712 | 704 | 801 |
| 2015 | 954 | 833 | 983 | 886 | 1,007 | 922 | 982 | 992 | 969 | 1,007 | 934 | 981 |
| 2016 | 999 | 1,061 | 1,059 | 1,090 | 1,067 | 1,052 | 1,161 | 1,261 | 1,114 | 1,197 | 1,117 | 1,163 |
| 2017 | 1,157 | 1,251 | 1,101 | 1,144 | 1,153 | 1,138 | 1,107 | 1,009 | 1,043 | 937 | 1,085 | 962 |
| 2018 | 944 | 1,046 | 959 | 1,199 | 1,132 | 1,049 | 1,123 | 1,124 | 1,043 | 1,313 | 1,228 | 1,476 |
| 2019 | 1,552 | 1,443 | 1,301 | 1,400 | 1,477 | 1,457 | 1,558 | 1,391 | 1,369 | 1,356 | 1,635 | 1,338 |
| 2020 | 1,685 | 1,394 | 1,489 | 1,416 | 1,590 | 1,481 | 1,394 | 1,503 | 1,252 | 1,326 | 1,507 | 1,065 |
| 2021 | 1,175 | 1,207 | 1,183 | 1,252 | 1,372 | 1,566 | 1,507 | 1,720 | 1,637 | 1,561 | 1,408 | 1,584 |
| 2022 | 2,488 | 2,442 | 2,606 | 2,250 | 2,680 | 2,564 | 2,467 | 2,157 | 2,016 | 2,224 | 2,377 | 2,982 |
| 2023 | 2,728 | 2,654 | 2,391 | 2,824 | 2,792 | 2,063 | 2,684 | 2,518 | 2,860 | 2,125 | 2,467 | 2,764 |
| 2024 | 2,548 | |||||||||||
| - = No Data Reported; -- = Not Applicable; NA = Not Available; W = Withheld to avoid disclosure of individual company data. |
| Release Date: 3/29/2024 |
| Next Release Date: 4/30/2024 |