|
Download Data (XLS File) |
|
||||||||
|
||||||||
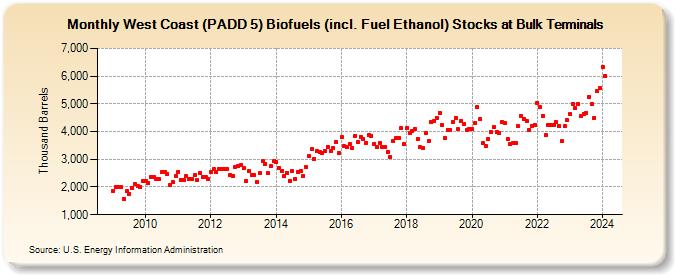
| West Coast (PADD 5) Biofuels (incl. Fuel Ethanol) Stocks at Bulk Terminals (Thousand Barrels) | ||||||||
| Year | Jan | Feb | Mar | Apr | May | Jun | Jul | Aug | Sep | Oct | Nov | Dec |
|---|---|---|---|---|---|---|---|---|---|---|---|---|
| 2009 | 1,870 | 2,013 | 2,010 | 1,997 | 1,579 | 1,852 | 1,750 | 1,957 | 2,100 | 2,042 | 2,000 | 2,217 |
| 2010 | 2,234 | 2,150 | 2,367 | 2,343 | 2,282 | 2,286 | 2,523 | 2,542 | 2,465 | 2,086 | 2,170 | 2,399 |
| 2011 | 2,555 | 2,253 | 2,244 | 2,383 | 2,291 | 2,298 | 2,426 | 2,267 | 2,510 | 2,360 | 2,370 | 2,288 |
| 2012 | 2,528 | 2,636 | 2,526 | 2,649 | 2,652 | 2,657 | 2,646 | 2,441 | 2,413 | 2,725 | 2,759 | 2,805 |
| 2013 | 2,685 | 2,212 | 2,583 | 2,428 | 2,431 | 2,188 | 2,503 | 2,932 | 2,846 | 2,502 | 2,750 | 2,927 |
| 2014 | 2,894 | 2,689 | 2,580 | 2,400 | 2,520 | 2,229 | 2,573 | 2,300 | 2,533 | 2,569 | 2,402 | 2,711 |
| 2015 | 3,117 | 3,374 | 3,021 | 3,297 | 3,257 | 3,239 | 3,293 | 3,450 | 3,304 | 3,423 | 3,624 | 3,233 |
| 2016 | 3,807 | 3,464 | 3,435 | 3,547 | 3,406 | 3,846 | 3,627 | 3,818 | 3,725 | 3,591 | 3,860 | 3,848 |
| 2017 | 3,553 | 3,429 | 3,573 | 3,426 | 3,426 | 3,263 | 3,078 | 3,672 | 3,759 | 3,781 | 4,122 | 3,538 |
| 2018 | 4,133 | 3,949 | 4,014 | 4,110 | 3,747 | 3,427 | 3,402 | 3,949 | 3,675 | 4,329 | 4,385 | 4,504 |
| 2019 | 4,681 | 4,236 | 3,765 | 4,066 | 4,048 | 4,345 | 4,493 | 4,080 | 4,388 | 4,285 | 4,062 | 4,099 |
| 2020 | 4,087 | 4,305 | 4,885 | 4,448 | 3,586 | 3,492 | 3,726 | 3,978 | 4,157 | 3,980 | 3,940 | 4,348 |
| 2021 | 4,323 | 3,745 | 3,542 | 3,604 | 3,585 | 4,196 | 4,559 | 4,467 | 4,382 | 4,071 | 4,204 | 4,232 |
| 2022 | 5,046 | 4,880 | 4,571 | 3,866 | 4,251 | 4,222 | 4,247 | 4,344 | 4,186 | 3,648 | 4,185 | 4,402 |
| 2023 | 4,626 | 5,005 | 4,839 | 5,000 | 4,565 | 4,644 | 4,679 | 5,259 | 4,992 | 4,503 | 5,468 | 5,559 |
| 2024 | 6,332 | |||||||||||
| - = No Data Reported; -- = Not Applicable; NA = Not Available; W = Withheld to avoid disclosure of individual company data. |
| Release Date: 3/29/2024 |
| Next Release Date: 4/30/2024 |