|
Download Data (XLS File) |
|
||||||||
|
||||||||
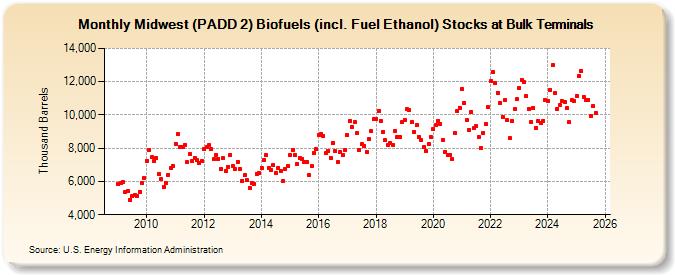
| Midwest (PADD 2) Biofuels (incl. Fuel Ethanol) Stocks at Bulk Terminals (Thousand Barrels) | ||||||||
| Year | Jan | Feb | Mar | Apr | May | Jun | Jul | Aug | Sep | Oct | Nov | Dec |
|---|---|---|---|---|---|---|---|---|---|---|---|---|
| 2009 | 5,827 | 5,914 | 5,995 | 5,348 | 5,449 | 4,911 | 5,122 | 5,198 | 5,146 | 5,387 | 5,914 | 6,206 |
| 2010 | 7,245 | 7,906 | 7,454 | 7,204 | 7,403 | 6,461 | 6,136 | 5,683 | 5,900 | 6,405 | 6,782 | 6,951 |
| 2011 | 8,274 | 8,848 | 8,076 | 8,054 | 8,215 | 7,164 | 7,660 | 7,232 | 7,435 | 7,269 | 7,125 | 7,204 |
| 2012 | 7,958 | 8,044 | 8,177 | 7,958 | 7,332 | 7,594 | 7,374 | 6,742 | 7,380 | 6,658 | 6,898 | 7,601 |
| 2013 | 6,957 | 6,774 | 7,176 | 6,758 | 6,035 | 6,364 | 6,064 | 5,607 | 5,903 | 5,864 | 6,459 | 6,497 |
| 2014 | 6,835 | 7,284 | 7,577 | 6,806 | 6,660 | 6,982 | 6,516 | 6,811 | 6,620 | 6,016 | 6,763 | 6,931 |
| 2015 | 7,576 | 7,878 | 7,591 | 7,055 | 7,417 | 7,372 | 7,175 | 7,199 | 6,363 | 6,904 | 7,708 | 7,926 |
| 2016 | 8,771 | 8,860 | 8,736 | 7,682 | 7,829 | 7,431 | 8,327 | 7,812 | 7,181 | 7,793 | 7,614 | 7,918 |
| 2017 | 8,807 | 9,637 | 9,284 | 9,572 | 8,906 | 7,881 | 8,237 | 8,150 | 7,771 | 8,532 | 9,019 | 9,738 |
| 2018 | 9,764 | 10,235 | 9,652 | 8,977 | 8,468 | 8,209 | 8,308 | 8,220 | 9,037 | 8,684 | 8,687 | 9,557 |
| 2019 | 9,698 | 10,330 | 10,306 | 9,571 | 8,991 | 9,379 | 8,688 | 8,483 | 8,056 | 7,851 | 8,263 | 8,660 |
| 2020 | 9,135 | 9,371 | 9,662 | 9,436 | 8,519 | 7,799 | 7,583 | 7,615 | 7,341 | 8,895 | 10,230 | 10,432 |
| 2021 | 11,575 | 10,724 | 9,667 | 9,097 | 10,186 | 9,188 | 9,312 | 8,684 | 8,003 | 8,908 | 9,442 | 10,466 |
| 2022 | 12,045 | 12,567 | 11,895 | 11,341 | 10,732 | 9,888 | 10,875 | 9,683 | 8,585 | 9,661 | 10,336 | 10,942 |
| 2023 | 11,654 | 12,016 | 11,895 | 10,994 | 10,189 | 9,496 | 10,340 | 9,130 | 9,594 | 9,601 | 9,653 | 10,940 |
| 2024 | 10,957 | 11,778 | ||||||||||
| - = No Data Reported; -- = Not Applicable; NA = Not Available; W = Withheld to avoid disclosure of individual company data. |
| Release Date: 4/30/2024 |
| Next Release Date: 5/31/2024 |