|
Download Data (XLS File) |
|
||||||||
|
||||||||
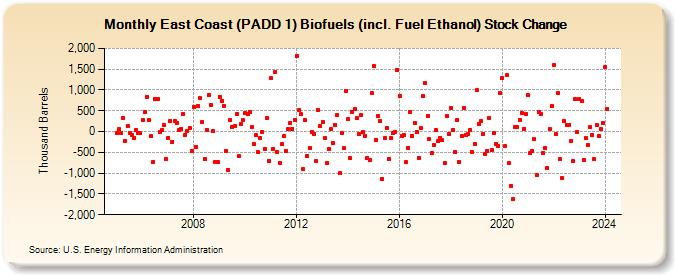
| East Coast (PADD 1) Biofuels (incl. Fuel Ethanol) Stock Change (Thousand Barrels) | ||||||||
| Year | Jan | Feb | Mar | Apr | May | Jun | Jul | Aug | Sep | Oct | Nov | Dec |
|---|---|---|---|---|---|---|---|---|---|---|---|---|
| 2005 | -44 | 57 | -26 | 325 | -227 | 130 | -30 | -78 | -144 | 44 | -24 | -32 |
| 2006 | 283 | 478 | 836 | 267 | -110 | -736 | 793 | 775 | -11 | 31 | 148 | -671 |
| 2007 | -156 | 251 | -240 | 261 | 202 | 43 | 72 | 432 | -82 | 23 | 88 | -472 |
| 2008 | 593 | -363 | 615 | 795 | 229 | -656 | 45 | 882 | 639 | 10 | -721 | -739 |
| 2009 | 837 | 745 | 625 | -466 | -914 | 279 | 120 | 123 | 425 | -576 | 180 | 276 |
| 2010 | 435 | 423 | 465 | 112 | -295 | -88 | -487 | -160 | -1 | -417 | 314 | -704 |
| 2011 | 1,281 | -408 | 1,437 | -501 | -755 | -309 | -116 | -478 | 59 | 208 | 71 | 284 |
| 2012 | 1,826 | 513 | 416 | -906 | 266 | -584 | -390 | -1 | -52 | -710 | 527 | 122 |
| 2013 | 229 | -166 | -754 | -420 | 69 | -278 | 164 | 404 | -1,006 | -27 | -398 | 984 |
| 2014 | 294 | -643 | 480 | 547 | 315 | -47 | 395 | -5 | -101 | -629 | -686 | 926 |
| 2015 | 1,572 | -199 | 379 | 248 | -1,139 | -161 | 97 | -666 | -165 | -42 | -3 | 1,481 |
| 2016 | 857 | -97 | -71 | -744 | -396 | 475 | -108 | 215 | -4 | -627 | 86 | 846 |
| 2017 | 1,170 | 373 | -180 | -524 | -319 | 31 | -224 | -157 | -210 | -750 | 367 | -58 |
| 2018 | 578 | 49 | -482 | 284 | -740 | -97 | 576 | -87 | -49 | 39 | -494 | -291 |
| 2019 | 988 | 179 | 254 | -69 | -529 | -457 | 324 | -444 | -36 | -311 | -357 | 929 |
| 2020 | 1,279 | -358 | 1,352 | -748 | -1,307 | -1,628 | 104 | 106 | 280 | 456 | 73 | 428 |
| 2021 | 887 | -504 | -471 | -181 | -1,036 | 482 | 411 | -509 | -393 | -887 | 59 | 611 |
| 2022 | 1,592 | -62 | 933 | -671 | -1,120 | 253 | 160 | 169 | -237 | -720 | 773 | -4 |
| 2023 | 782 | 729 | -676 | -155 | -327 | 108 | -77 | -668 | 148 | -111 | 58 | 212 |
| 2024 | 1,550 | |||||||||||
| - = No Data Reported; -- = Not Applicable; NA = Not Available; W = Withheld to avoid disclosure of individual company data. |
| Release Date: 3/29/2024 |
| Next Release Date: 4/30/2024 |