|
Download Data (XLS File) |
|
||||||||
|
||||||||
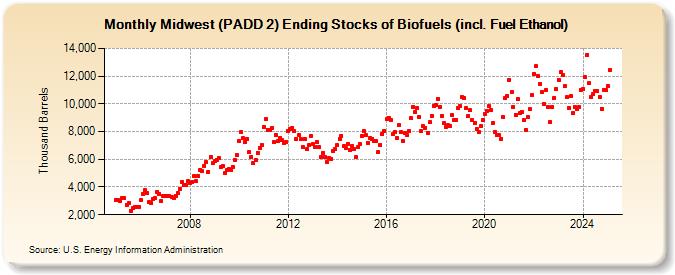
| Midwest (PADD 2) Ending Stocks of Biofuels (incl. Fuel Ethanol) (Thousand Barrels) | ||||||||
| Year | Jan | Feb | Mar | Apr | May | Jun | Jul | Aug | Sep | Oct | Nov | Dec |
|---|---|---|---|---|---|---|---|---|---|---|---|---|
| 2005 | 3,042 | 3,028 | 3,023 | 3,224 | 3,188 | 2,736 | 2,813 | 2,282 | 2,471 | 2,559 | 2,572 | 2,591 |
| 2006 | 3,041 | 3,521 | 3,758 | 3,552 | 2,885 | 2,871 | 3,121 | 3,193 | 3,674 | 3,495 | 3,002 | 3,320 |
| 2007 | 3,344 | 3,344 | 3,333 | 3,307 | 3,239 | 3,383 | 3,548 | 3,870 | 4,344 | 4,122 | 4,124 | 4,405 |
| 2008 | 4,323 | 4,362 | 4,765 | 4,400 | 4,811 | 5,253 | 5,127 | 5,547 | 5,773 | 5,086 | 6,177 | 5,712 |
| 2009 | 5,886 | 5,974 | 6,083 | 5,432 | 5,530 | 4,977 | 5,201 | 5,272 | 5,219 | 5,451 | 5,965 | 6,274 |
| 2010 | 7,307 | 7,964 | 7,515 | 7,260 | 7,452 | 6,516 | 6,178 | 5,717 | 5,961 | 6,474 | 6,847 | 7,024 |
| 2011 | 8,343 | 8,900 | 8,134 | 8,119 | 8,275 | 7,227 | 7,781 | 7,328 | 7,541 | 7,358 | 7,202 | 7,275 |
| 2012 | 8,067 | 8,149 | 8,265 | 8,018 | 7,461 | 7,717 | 7,483 | 6,855 | 7,454 | 6,756 | 6,999 | 7,687 |
| 2013 | 7,099 | 6,896 | 7,269 | 6,869 | 6,165 | 6,462 | 6,187 | 5,789 | 6,089 | 6,002 | 6,622 | 6,706 |
| 2014 | 6,996 | 7,472 | 7,715 | 6,935 | 6,840 | 7,121 | 6,655 | 6,937 | 6,744 | 6,140 | 6,866 | 7,086 |
| 2015 | 7,708 | 8,012 | 7,720 | 7,186 | 7,543 | 7,470 | 7,306 | 7,313 | 6,500 | 7,033 | 7,831 | 8,056 |
| 2016 | 8,896 | 9,012 | 8,867 | 7,819 | 7,964 | 7,548 | 8,443 | 7,947 | 7,307 | 7,908 | 7,750 | 8,047 |
| 2017 | 8,951 | 9,791 | 9,432 | 9,688 | 9,051 | 8,010 | 8,373 | 8,267 | 7,919 | 8,660 | 9,147 | 9,865 |
| 2018 | 9,904 | 10,377 | 9,801 | 9,139 | 8,609 | 8,355 | 8,466 | 8,375 | 9,174 | 8,803 | 8,822 | 9,676 |
| 2019 | 9,829 | 10,487 | 10,431 | 9,697 | 9,147 | 9,522 | 8,811 | 8,624 | 8,190 | 7,992 | 8,392 | 8,804 |
| 2020 | 9,292 | 9,504 | 9,832 | 9,579 | 8,629 | 7,935 | 7,718 | 7,733 | 7,481 | 9,030 | 10,402 | 10,576 |
| 2021 | 11,715 | 10,863 | 9,787 | 9,223 | 10,328 | 9,312 | 9,439 | 8,805 | 8,132 | 9,033 | 9,592 | 10,614 |
| 2022 | 12,181 | 12,700 | 12,008 | 11,459 | 10,846 | 10,008 | 10,994 | 9,778 | 8,687 | 9,754 | 10,449 | 11,055 |
| 2023 | 11,767 | 12,151 | 12,019 | 11,145 | 10,317 | 9,608 | 10,468 | 9,243 | 9,713 | 9,717 | 9,787 | 11,068 |
| 2024 | 11,070 | 11,917 | ||||||||||
| - = No Data Reported; -- = Not Applicable; NA = Not Available; W = Withheld to avoid disclosure of individual company data. |
| Release Date: 4/30/2024 |
| Next Release Date: 5/31/2024 |