|
Download Data (XLS File) |
|
||||||||
|
||||||||
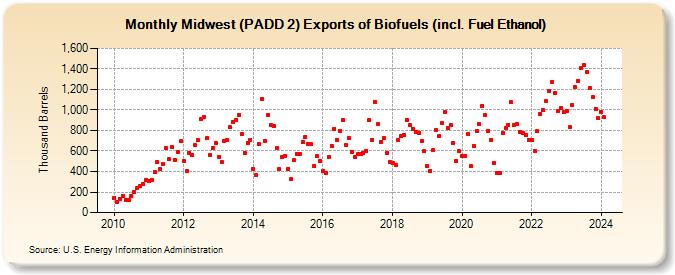
| Midwest (PADD 2) Exports of Biofuels (incl. Fuel Ethanol) (Thousand Barrels) | ||||||||
| Year | Jan | Feb | Mar | Apr | May | Jun | Jul | Aug | Sep | Oct | Nov | Dec |
|---|---|---|---|---|---|---|---|---|---|---|---|---|
| 2010 | 144 | 105 | 134 | 166 | 122 | 127 | 158 | 199 | 236 | 255 | 282 | 315 |
| 2011 | 303 | 319 | 392 | 495 | 421 | 475 | 625 | 518 | 637 | 512 | 592 | 694 |
| 2012 | 504 | 402 | 583 | 557 | 654 | 704 | 910 | 933 | 724 | 562 | 627 | 680 |
| 2013 | 545 | 493 | 702 | 712 | 831 | 884 | 900 | 955 | 767 | 581 | 682 | 711 |
| 2014 | 423 | 365 | 668 | 1,111 | 695 | 954 | 850 | 841 | 626 | 420 | 537 | 553 |
| 2015 | 428 | 325 | 512 | 572 | 571 | 689 | 738 | 664 | 665 | 453 | 547 | 504 |
| 2016 | 405 | 386 | 542 | 651 | 819 | 705 | 799 | 902 | 659 | 722 | 586 | 543 |
| 2017 | 568 | 574 | 578 | 604 | 900 | 705 | 1,081 | 859 | 689 | 731 | 580 | 493 |
| 2018 | 479 | 468 | 709 | 748 | 759 | 901 | 849 | 819 | 785 | 771 | 695 | 596 |
| 2019 | 449 | 403 | 606 | 801 | 743 | 872 | 984 | 822 | 855 | 682 | 506 | 596 |
| 2020 | 552 | 552 | 770 | 449 | 653 | 793 | 859 | 1,041 | 946 | 795 | 710 | 484 |
| 2021 | 387 | 383 | 778 | 822 | 856 | 1,074 | 854 | 864 | 787 | 776 | 754 | 710 |
| 2022 | 709 | 601 | 794 | 960 | 999 | 1,083 | 1,180 | 1,277 | 1,165 | 988 | 1,023 | 979 |
| 2023 | 987 | 829 | 1,048 | 1,220 | 1,287 | 1,412 | 1,440 | 1,372 | 1,215 | 1,122 | 1,012 | 917 |
| 2024 | 982 | |||||||||||
| - = No Data Reported; -- = Not Applicable; NA = Not Available; W = Withheld to avoid disclosure of individual company data. |
| Release Date: 3/29/2024 |
| Next Release Date: 4/30/2024 |