|
Download Data (XLS File) |
|
||||||||
|
||||||||
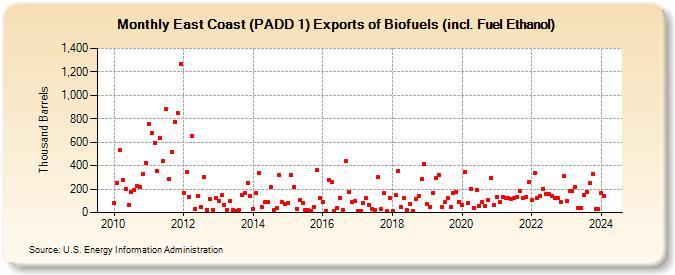
| East Coast (PADD 1) Exports of Biofuels (incl. Fuel Ethanol) (Thousand Barrels) | ||||||||
| Year | Jan | Feb | Mar | Apr | May | Jun | Jul | Aug | Sep | Oct | Nov | Dec |
|---|---|---|---|---|---|---|---|---|---|---|---|---|
| 2010 | 85 | 256 | 530 | 274 | 198 | 67 | 173 | 192 | 226 | 215 | 330 | 425 |
| 2011 | 753 | 676 | 594 | 355 | 637 | 438 | 880 | 285 | 520 | 775 | 845 | 1,267 |
| 2012 | 167 | 348 | 135 | 655 | 34 | 140 | 48 | 304 | 22 | 113 | 26 | 125 |
| 2013 | 96 | 148 | 67 | 23 | 95 | 23 | 12 | 21 | 151 | 163 | 250 | 137 |
| 2014 | 29 | 169 | 336 | 47 | 86 | 88 | 217 | 22 | 35 | 319 | 91 | 76 |
| 2015 | 85 | 324 | 216 | 31 | 103 | 85 | 20 | 18 | 11 | 45 | 365 | 120 |
| 2016 | 89 | 15 | 280 | 261 | 14 | 43 | 128 | 19 | 436 | 177 | 86 | 96 |
| 2017 | 12 | 16 | 78 | 121 | 63 | 34 | 20 | 300 | 29 | 163 | 15 | 121 |
| 2018 | 17 | 151 | 357 | 45 | 122 | 19 | 73 | 15 | 112 | 139 | 286 | 418 |
| 2019 | 69 | 50 | 171 | 298 | 322 | 51 | 87 | 124 | 48 | 167 | 175 | 91 |
| 2020 | 64 | 342 | 84 | 204 | 42 | 189 | 54 | 87 | 55 | 104 | 297 | 65 |
| 2021 | 132 | 94 | 133 | 123 | 122 | 118 | 125 | 131 | 187 | 127 | 131 | 258 |
| 2022 | 105 | 335 | 128 | 140 | 197 | 157 | 160 | 139 | 120 | 122 | 94 | 309 |
| 2023 | 98 | 184 | 181 | 222 | 37 | 41 | 150 | 177 | 251 | 331 | 34 | 30 |
| 2024 | 164 | |||||||||||
| - = No Data Reported; -- = Not Applicable; NA = Not Available; W = Withheld to avoid disclosure of individual company data. |
| Release Date: 3/29/2024 |
| Next Release Date: 4/30/2024 |