|
Download Data (XLS File) |
|
||||||||
|
||||||||
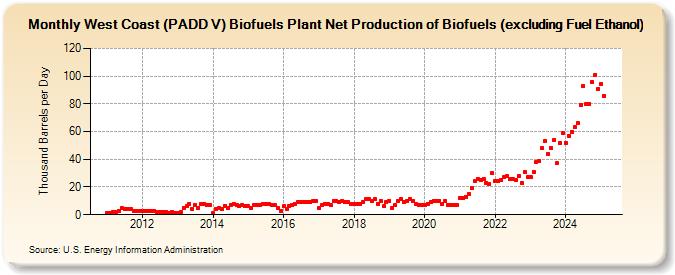
| West Coast (PADD V) Biofuels Plant Net Production of Biofuels (excluding Fuel Ethanol) (Thousand Barrels per Day) | ||||||||
| Year | Jan | Feb | Mar | Apr | May | Jun | Jul | Aug | Sep | Oct | Nov | Dec |
|---|---|---|---|---|---|---|---|---|---|---|---|---|
| 2011 | 1 | 1 | 2 | 2 | 3 | 5 | 4 | 4 | 4 | 3 | 3 | 3 |
| 2012 | 3 | 3 | 3 | 3 | 3 | 2 | 2 | 2 | 2 | 1 | 2 | 1 |
| 2013 | 1 | 2 | 5 | 6 | 8 | 4 | 7 | 5 | 8 | 8 | 7 | 7 |
| 2014 | 1 | 4 | 5 | 4 | 6 | 5 | 7 | 8 | 7 | 6 | 7 | 6 |
| 2015 | 6 | 5 | 7 | 7 | 7 | 8 | 8 | 8 | 7 | 7 | 5 | 3 |
| 2016 | 6 | 4 | 6 | 7 | 8 | 9 | 9 | 9 | 9 | 9 | 10 | 10 |
| 2017 | 5 | 7 | 8 | 8 | 7 | 10 | 10 | 9 | 10 | 9 | 9 | 8 |
| 2018 | 8 | 8 | 8 | 9 | 11 | 11 | 10 | 11 | 8 | 10 | 6 | 9 |
| 2019 | 10 | 5 | 7 | 10 | 11 | 9 | 10 | 11 | 10 | 8 | 7 | 7 |
| 2020 | 7 | 8 | 9 | 10 | 10 | 10 | 8 | 10 | 7 | 7 | 7 | 7 |
| 2021 | 12 | 12 | 13 | 15 | 19 | 24 | 26 | 25 | 26 | 23 | 22 | 30 |
| 2022 | 24 | 24 | 25 | 27 | 28 | 26 | 26 | 25 | 28 | 23 | 31 | 27 |
| 2023 | 27 | 31 | 38 | 39 | 48 | 53 | 44 | 48 | 54 | 37 | 52 | 59 |
| 2024 | 52 | 57 | 60 | 63 | 66 | 79 | ||||||
| - = No Data Reported; -- = Not Applicable; NA = Not Available; W = Withheld to avoid disclosure of individual company data. |
| Release Date: 8/30/2024 |
| Next Release Date: 9/30/2024 |