|
Download Data (XLS File) |
|
||||||||
|
||||||||
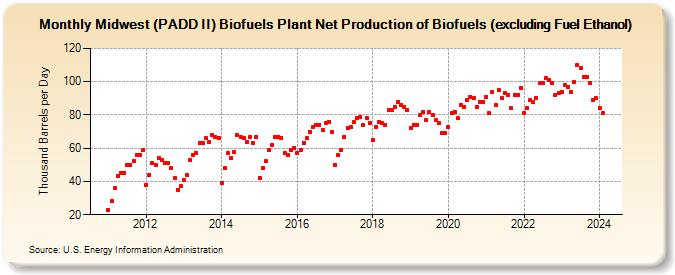
| Midwest (PADD II) Biofuels Plant Net Production of Biofuels (excluding Fuel Ethanol) (Thousand Barrels per Day) | ||||||||
| Year | Jan | Feb | Mar | Apr | May | Jun | Jul | Aug | Sep | Oct | Nov | Dec |
|---|---|---|---|---|---|---|---|---|---|---|---|---|
| 2011 | 23 | 28 | 36 | 43 | 45 | 45 | 50 | 50 | 52 | 56 | 56 | 59 |
| 2012 | 38 | 44 | 51 | 50 | 54 | 53 | 51 | 51 | 48 | 42 | 35 | 37 |
| 2013 | 41 | 44 | 53 | 56 | 57 | 63 | 63 | 66 | 64 | 68 | 67 | 66 |
| 2014 | 39 | 48 | 57 | 54 | 58 | 68 | 67 | 66 | 64 | 67 | 63 | 67 |
| 2015 | 42 | 48 | 52 | 59 | 62 | 67 | 67 | 66 | 57 | 56 | 59 | 60 |
| 2016 | 57 | 59 | 63 | 66 | 70 | 73 | 74 | 74 | 71 | 75 | 76 | 70 |
| 2017 | 50 | 56 | 59 | 67 | 72 | 73 | 76 | 78 | 79 | 74 | 78 | 75 |
| 2018 | 65 | 73 | 76 | 75 | 74 | 83 | 83 | 85 | 88 | 86 | 85 | 83 |
| 2019 | 72 | 74 | 74 | 80 | 82 | 77 | 82 | 80 | 77 | 75 | 69 | 69 |
| 2020 | 73 | 81 | 82 | 78 | 86 | 85 | 89 | 91 | 90 | 85 | 88 | 88 |
| 2021 | 91 | 81 | 94 | 86 | 95 | 90 | 93 | 92 | 84 | 92 | 92 | 96 |
| 2022 | 81 | 84 | 89 | 88 | 90 | 99 | 99 | 102 | 101 | 99 | 92 | 93 |
| 2023 | 94 | 98 | 97 | 94 | 100 | 110 | 108 | 103 | 103 | 99 | 89 | 90 |
| 2024 | 84 | |||||||||||
| - = No Data Reported; -- = Not Applicable; NA = Not Available; W = Withheld to avoid disclosure of individual company data. |
| Release Date: 3/29/2024 |
| Next Release Date: 4/30/2024 |