|
Download Data (XLS File) |
|
||||||||
|
||||||||
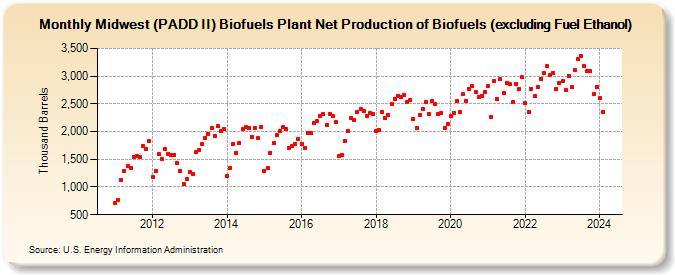
| Midwest (PADD II) Biofuels Plant Net Production of Biofuels (excluding Fuel Ethanol) (Thousand Barrels) | ||||||||
| Year | Jan | Feb | Mar | Apr | May | Jun | Jul | Aug | Sep | Oct | Nov | Dec |
|---|---|---|---|---|---|---|---|---|---|---|---|---|
| 2011 | 718 | 772 | 1,127 | 1,294 | 1,385 | 1,343 | 1,544 | 1,562 | 1,549 | 1,737 | 1,687 | 1,828 |
| 2012 | 1,183 | 1,284 | 1,588 | 1,504 | 1,687 | 1,601 | 1,578 | 1,583 | 1,426 | 1,291 | 1,054 | 1,147 |
| 2013 | 1,276 | 1,236 | 1,628 | 1,670 | 1,778 | 1,889 | 1,963 | 2,059 | 1,919 | 2,099 | 2,009 | 2,043 |
| 2014 | 1,201 | 1,349 | 1,778 | 1,619 | 1,801 | 2,039 | 2,074 | 2,059 | 1,905 | 2,066 | 1,885 | 2,089 |
| 2015 | 1,288 | 1,340 | 1,622 | 1,785 | 1,929 | 2,005 | 2,081 | 2,043 | 1,700 | 1,736 | 1,781 | 1,861 |
| 2016 | 1,771 | 1,706 | 1,967 | 1,969 | 2,160 | 2,185 | 2,283 | 2,308 | 2,126 | 2,310 | 2,276 | 2,169 |
| 2017 | 1,559 | 1,580 | 1,823 | 2,014 | 2,242 | 2,200 | 2,355 | 2,408 | 2,364 | 2,285 | 2,338 | 2,323 |
| 2018 | 2,002 | 2,032 | 2,350 | 2,237 | 2,305 | 2,493 | 2,582 | 2,648 | 2,630 | 2,659 | 2,540 | 2,569 |
| 2019 | 2,229 | 2,063 | 2,305 | 2,413 | 2,527 | 2,319 | 2,554 | 2,489 | 2,312 | 2,331 | 2,071 | 2,136 |
| 2020 | 2,276 | 2,339 | 2,544 | 2,346 | 2,672 | 2,555 | 2,771 | 2,817 | 2,713 | 2,624 | 2,646 | 2,722 |
| 2021 | 2,828 | 2,264 | 2,912 | 2,582 | 2,941 | 2,691 | 2,883 | 2,852 | 2,529 | 2,864 | 2,760 | 2,979 |
| 2022 | 2,509 | 2,346 | 2,774 | 2,638 | 2,803 | 2,956 | 3,059 | 3,175 | 3,026 | 3,059 | 2,763 | 2,882 |
| 2023 | 2,913 | 2,743 | 3,006 | 2,811 | 3,111 | 3,315 | 3,359 | 3,181 | 3,101 | 3,084 | 2,676 | 2,800 |
| 2024 | 2,606 | |||||||||||
| - = No Data Reported; -- = Not Applicable; NA = Not Available; W = Withheld to avoid disclosure of individual company data. |
| Release Date: 3/29/2024 |
| Next Release Date: 4/30/2024 |