|
Download Data (XLS File) |
|
||||||||
|
||||||||
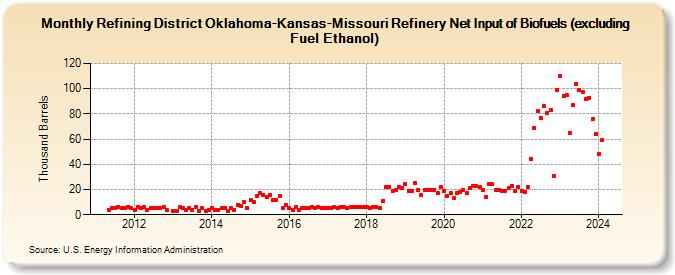
| Refining District Oklahoma-Kansas-Missouri Refinery Net Input of Biofuels (excluding Fuel Ethanol) (Thousand Barrels) | ||||||||
| Year | Jan | Feb | Mar | Apr | May | Jun | Jul | Aug | Sep | Oct | Nov | Dec |
|---|---|---|---|---|---|---|---|---|---|---|---|---|
| 2011 | 4 | 5 | 5 | 6 | 5 | 5 | 6 | 5 | ||||
| 2012 | 4 | 6 | 5 | 6 | 4 | 5 | 5 | 5 | 5 | 6 | 4 | |
| 2013 | 3 | 3 | 6 | 5 | 4 | 5 | 4 | 6 | 3 | 5 | 3 | 4 |
| 2014 | 5 | 4 | 4 | 5 | 5 | 3 | 5 | 4 | 8 | 7 | 10 | 5 |
| 2015 | 12 | 10 | 15 | 17 | 16 | 14 | 16 | 12 | 12 | 15 | 5 | 8 |
| 2016 | 5 | 4 | 6 | 4 | 5 | 5 | 5 | 6 | 5 | 6 | 5 | 5 |
| 2017 | 5 | 5 | 6 | 5 | 6 | 6 | 5 | 6 | 6 | 6 | 6 | 6 |
| 2018 | 6 | 5 | 6 | 6 | 5 | 11 | 22 | 22 | 19 | 20 | 22 | 21 |
| 2019 | 24 | 19 | 19 | 25 | 20 | 16 | 20 | 20 | 20 | 20 | 17 | 22 |
| 2020 | 19 | 15 | 17 | 13 | 17 | 18 | 20 | 17 | 21 | 23 | 23 | 22 |
| 2021 | 20 | 14 | 24 | 24 | 20 | 20 | 19 | 19 | 21 | 23 | 19 | 22 |
| 2022 | 19 | 18 | 22 | 44 | 69 | 82 | 77 | 86 | 81 | 83 | 31 | 99 |
| 2023 | 110 | 94 | 95 | 65 | 87 | 104 | 99 | 97 | 92 | 93 | 76 | 64 |
| 2024 | 48 | 59 | ||||||||||
| - = No Data Reported; -- = Not Applicable; NA = Not Available; W = Withheld to avoid disclosure of individual company data. |
| Release Date: 4/30/2024 |
| Next Release Date: 5/31/2024 |