|
Download Data (XLS File) |
|
||||||||
|
||||||||
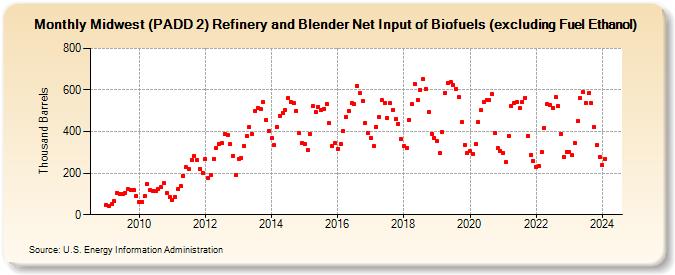
| Midwest (PADD 2) Refinery and Blender Net Input of Biofuels (excluding Fuel Ethanol) (Thousand Barrels) | ||||||||
| Year | Jan | Feb | Mar | Apr | May | Jun | Jul | Aug | Sep | Oct | Nov | Dec |
|---|---|---|---|---|---|---|---|---|---|---|---|---|
| 2009 | 46 | 43 | 50 | 65 | 106 | 99 | 98 | 106 | 122 | 120 | 118 | 91 |
| 2010 | 63 | 63 | 88 | 147 | 117 | 114 | 115 | 124 | 131 | 151 | 103 | 83 |
| 2011 | 72 | 86 | 122 | 137 | 188 | 228 | 218 | 261 | 283 | 264 | 222 | 203 |
| 2012 | 269 | 178 | 193 | 270 | 321 | 339 | 343 | 388 | 384 | 339 | 284 | 191 |
| 2013 | 268 | 272 | 332 | 378 | 423 | 388 | 498 | 513 | 507 | 541 | 456 | 404 |
| 2014 | 368 | 334 | 422 | 477 | 490 | 506 | 562 | 540 | 536 | 500 | 391 | 344 |
| 2015 | 340 | 312 | 389 | 522 | 496 | 520 | 506 | 510 | 533 | 439 | 331 | 343 |
| 2016 | 318 | 340 | 402 | 470 | 501 | 535 | 533 | 619 | 587 | 548 | 442 | 395 |
| 2017 | 369 | 331 | 424 | 471 | 550 | 539 | 465 | 535 | 505 | 460 | 438 | 363 |
| 2018 | 330 | 323 | 457 | 531 | 629 | 553 | 601 | 652 | 605 | 495 | 390 | 370 |
| 2019 | 356 | 295 | 397 | 586 | 632 | 638 | 622 | 606 | 564 | 444 | 337 | 295 |
| 2020 | 306 | 291 | 339 | 447 | 503 | 540 | 551 | 551 | 581 | 395 | 319 | 307 |
| 2021 | 299 | 252 | 379 | 521 | 535 | 544 | 513 | 543 | 563 | 380 | 288 | 259 |
| 2022 | 231 | 234 | 300 | 417 | 532 | 528 | 514 | 565 | 522 | 389 | 278 | 302 |
| 2023 | 302 | 285 | 347 | 450 | 562 | 588 | 537 | 584 | 537 | 422 | 333 | 279 |
| 2024 | 238 | |||||||||||
| - = No Data Reported; -- = Not Applicable; NA = Not Available; W = Withheld to avoid disclosure of individual company data. |
| Release Date: 3/29/2024 |
| Next Release Date: 4/30/2024 |