|
Download Data (XLS File) |
|
||||||||
|
||||||||
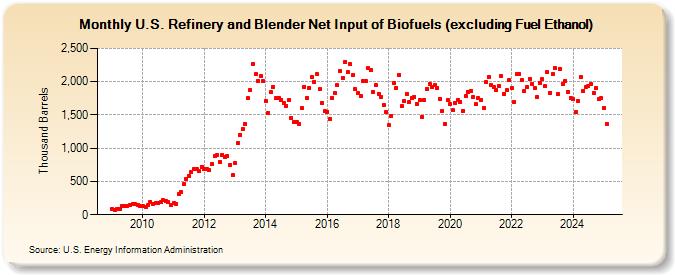
| U.S. Refinery and Blender Net Input of Biofuels (excluding Fuel Ethanol) (Thousand Barrels) | ||||||||
| Year | Jan | Feb | Mar | Apr | May | Jun | Jul | Aug | Sep | Oct | Nov | Dec |
|---|---|---|---|---|---|---|---|---|---|---|---|---|
| 2009 | 79 | 73 | 79 | 93 | 136 | 125 | 133 | 146 | 160 | 160 | 146 | 127 |
| 2010 | 125 | 117 | 139 | 195 | 168 | 176 | 173 | 186 | 219 | 209 | 185 | 150 |
| 2011 | 173 | 167 | 307 | 344 | 460 | 534 | 580 | 639 | 687 | 683 | 651 | 718 |
| 2012 | 688 | 682 | 665 | 763 | 878 | 891 | 794 | 899 | 867 | 885 | 748 | 594 |
| 2013 | 784 | 1,075 | 1,203 | 1,288 | 1,368 | 1,753 | 1,877 | 2,271 | 2,113 | 2,015 | 2,080 | 2,008 |
| 2014 | 1,713 | 1,529 | 1,837 | 1,921 | 1,748 | 1,757 | 1,728 | 1,673 | 1,638 | 1,721 | 1,452 | 1,396 |
| 2015 | 1,396 | 1,370 | 1,601 | 1,927 | 1,758 | 1,912 | 2,065 | 1,996 | 2,111 | 1,885 | 1,676 | 1,553 |
| 2016 | 1,551 | 1,442 | 1,756 | 1,823 | 1,944 | 2,153 | 2,059 | 2,302 | 2,138 | 2,261 | 2,107 | 1,884 |
| 2017 | 1,825 | 1,785 | 2,015 | 2,006 | 2,200 | 2,170 | 1,847 | 1,944 | 1,821 | 1,771 | 1,642 | 1,548 |
| 2018 | 1,342 | 1,489 | 1,983 | 1,910 | 2,104 | 1,637 | 1,715 | 1,817 | 1,692 | 1,757 | 1,775 | 1,666 |
| 2019 | 1,727 | 1,474 | 1,722 | 1,896 | 1,960 | 1,913 | 1,946 | 1,902 | 1,741 | 1,561 | 1,365 | 1,730 |
| 2020 | 1,660 | 1,571 | 1,676 | 1,723 | 1,699 | 1,565 | 1,779 | 1,845 | 1,865 | 1,770 | 1,659 | 1,750 |
| 2021 | 1,724 | 1,601 | 1,994 | 2,069 | 1,949 | 1,921 | 1,873 | 1,935 | 2,081 | 1,821 | 1,873 | 2,019 |
| 2022 | 1,901 | 1,695 | 2,109 | 2,113 | 2,022 | 1,861 | 1,921 | 2,043 | 1,970 | 1,902 | 1,770 | 1,982 |
| 2023 | 1,998 | 1,896 | 2,187 | 1,828 | 2,103 | 2,201 | 1,813 | 2,158 | 2,085 | 1,992 | 1,826 | 1,738 |
| 2024 | 1,734 | |||||||||||
| - = No Data Reported; -- = Not Applicable; NA = Not Available; W = Withheld to avoid disclosure of individual company data. |
| Release Date: 3/29/2024 |
| Next Release Date: 4/30/2024 |