|
Download Data (XLS File) |
|
||||||||
|
||||||||
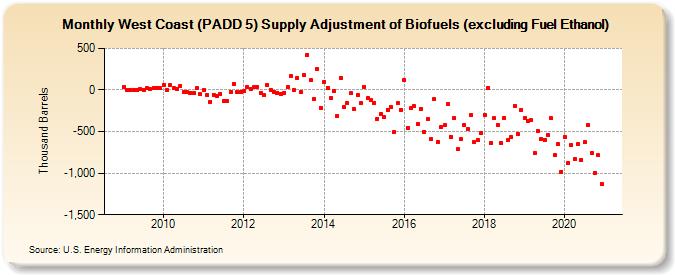
| West Coast (PADD 5) Supply Adjustment of Biofuels (excluding Fuel Ethanol) (Thousand Barrels) | ||||||||
| Year | Jan | Feb | Mar | Apr | May | Jun | Jul | Aug | Sep | Oct | Nov | Dec |
|---|---|---|---|---|---|---|---|---|---|---|---|---|
| 2009 | 40 | 3 | 5 | 1 | -1 | 9 | 5 | 22 | 15 | 24 | 27 | 18 |
| 2010 | 63 | 2 | 57 | 19 | 6 | 51 | -23 | -25 | -33 | -34 | 18 | -52 |
| 2011 | 1 | -58 | -140 | -60 | -78 | -51 | -134 | -133 | -20 | 73 | -28 | -20 |
| 2012 | -11 | 34 | 17 | 32 | 40 | -31 | -61 | 57 | 2 | -20 | -32 | -43 |
| 2013 | -35 | 30 | 162 | 2 | 149 | -27 | 179 | 424 | 115 | -106 | 253 | -211 |
| 2014 | 99 | 24 | -98 | -9 | -316 | 144 | -210 | -158 | -40 | -231 | -59 | -160 |
| 2015 | 40 | -98 | -126 | -152 | -345 | -290 | -330 | -239 | -199 | -506 | -162 | -240 |
| 2016 | 119 | -454 | -220 | -198 | -410 | -224 | -502 | -353 | -589 | -110 | -623 | -444 |
| 2017 | -427 | -173 | -562 | -338 | -713 | -590 | -421 | -472 | -306 | -623 | -599 | -518 |
| 2018 | -303 | 25 | -634 | -342 | -422 | -635 | -336 | -603 | -566 | -192 | -533 | -237 |
| 2019 | -333 | -371 | -367 | -758 | -498 | -589 | -598 | -544 | -343 | -782 | -655 | -983 |
| 2020 | -565 | -875 | -660 | -828 | -648 | -841 | -629 | -423 | -760 | -993 | -786 | -1,125 |
| - = No Data Reported; -- = Not Applicable; NA = Not Available; W = Withheld to avoid disclosure of individual company data. |
| Release Date: 3/29/2024 |
| Next Release Date: 4/30/2024 |