|
Download Data (XLS File) |
|
||||||||
|
||||||||
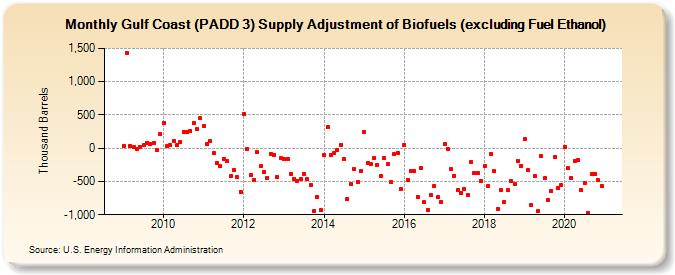
| Gulf Coast (PADD 3) Supply Adjustment of Biofuels (excluding Fuel Ethanol) (Thousand Barrels) | ||||||||
| Year | Jan | Feb | Mar | Apr | May | Jun | Jul | Aug | Sep | Oct | Nov | Dec |
|---|---|---|---|---|---|---|---|---|---|---|---|---|
| 2009 | 34 | 1,437 | 39 | 12 | -10 | 19 | 46 | 78 | 68 | 78 | -32 | 218 |
| 2010 | 378 | 27 | 50 | 115 | 47 | 91 | 245 | 250 | 260 | 378 | 282 | 449 |
| 2011 | 333 | 61 | 104 | -75 | -230 | -272 | -159 | -189 | -424 | -322 | -440 | -653 |
| 2012 | 515 | -8 | -401 | -474 | -63 | -272 | -361 | -445 | -80 | -103 | -435 | -151 |
| 2013 | -163 | -156 | -383 | -463 | -487 | -470 | -384 | -468 | -560 | -940 | -741 | -930 |
| 2014 | -101 | 311 | -98 | -75 | -24 | 55 | -168 | -765 | -543 | -310 | -507 | -348 |
| 2015 | 247 | -224 | -243 | -142 | -250 | -417 | -150 | -236 | -507 | -88 | -67 | -619 |
| 2016 | 46 | -471 | -346 | -350 | -731 | -299 | -813 | -924 | -702 | -565 | -739 | -812 |
| 2017 | 56 | -15 | -318 | -411 | -633 | -677 | -617 | -700 | -207 | -368 | -368 | -496 |
| 2018 | -269 | -565 | -81 | -348 | -914 | -633 | -807 | -623 | -500 | -539 | -192 | -263 |
| 2019 | 138 | -329 | -859 | -411 | -951 | -123 | -453 | -774 | -637 | -129 | -595 | -558 |
| 2020 | 15 | -301 | -448 | -192 | -177 | -628 | -523 | -973 | -392 | -389 | -480 | -561 |
| - = No Data Reported; -- = Not Applicable; NA = Not Available; W = Withheld to avoid disclosure of individual company data. |
| Release Date: 3/29/2024 |
| Next Release Date: 4/30/2024 |