|
Download Data (XLS File) |
|
||||||||
|
||||||||
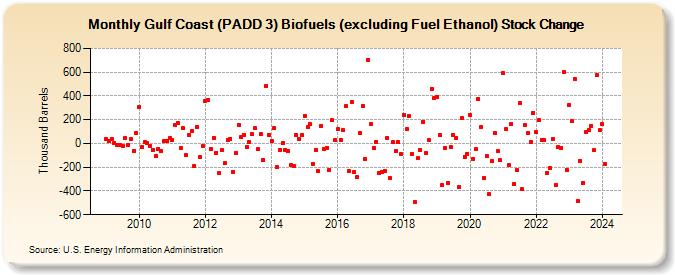
| Gulf Coast (PADD 3) Biofuels (excluding Fuel Ethanol) Stock Change (Thousand Barrels) | ||||||||
| Year | Jan | Feb | Mar | Apr | May | Jun | Jul | Aug | Sep | Oct | Nov | Dec |
|---|---|---|---|---|---|---|---|---|---|---|---|---|
| 2009 | 34 | 17 | 39 | 6 | -13 | -11 | -18 | 47 | -13 | 35 | -61 | 90 |
| 2010 | 306 | -31 | 11 | 0 | -21 | -53 | -108 | -47 | -66 | 20 | 21 | 42 |
| 2011 | 25 | 155 | 174 | -42 | 127 | -99 | 74 | 105 | -194 | 137 | -116 | -20 |
| 2012 | 360 | 367 | -47 | 48 | -78 | -251 | -52 | -168 | 29 | 40 | -239 | -82 |
| 2013 | 157 | 58 | 75 | -27 | 8 | 76 | 128 | -51 | 79 | -140 | 485 | 69 |
| 2014 | 21 | 126 | -201 | -55 | 3 | -56 | -66 | -182 | -190 | 69 | 34 | 75 |
| 2015 | 233 | 137 | 161 | -175 | -57 | -233 | 148 | -43 | -36 | -221 | 195 | 26 |
| 2016 | 118 | 33 | 109 | 311 | -232 | 349 | -239 | -285 | 86 | 315 | -132 | 701 |
| 2017 | 161 | -37 | 13 | -248 | -244 | -232 | 45 | -289 | 12 | -67 | 8 | -92 |
| 2018 | 237 | 120 | 231 | -86 | -490 | -125 | -55 | 183 | -84 | 29 | 462 | 383 |
| 2019 | 394 | 71 | -352 | -39 | -333 | -28 | 75 | 48 | -368 | 210 | -113 | -85 |
| 2020 | 241 | -130 | -51 | 374 | 138 | -287 | -106 | -428 | -148 | 87 | -66 | -142 |
| 2021 | 592 | 119 | -181 | 166 | -339 | -227 | 339 | -386 | 152 | 90 | 10 | 260 |
| 2022 | 93 | 199 | 33 | 26 | -245 | -208 | 41 | -349 | -27 | -36 | 601 | -220 |
| 2023 | 326 | 186 | 540 | -487 | -144 | -333 | 98 | 112 | 150 | -58 | 576 | 112 |
| 2024 | 164 | |||||||||||
| - = No Data Reported; -- = Not Applicable; NA = Not Available; W = Withheld to avoid disclosure of individual company data. |
| Release Date: 3/29/2024 |
| Next Release Date: 4/30/2024 |