|
Download Data (XLS File) |
|
||||||||
|
||||||||
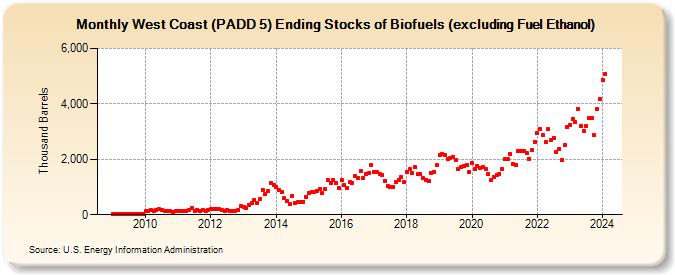
| West Coast (PADD 5) Ending Stocks of Biofuels (excluding Fuel Ethanol) (Thousand Barrels) | ||||||||
| Year | Jan | Feb | Mar | Apr | May | Jun | Jul | Aug | Sep | Oct | Nov | Dec |
|---|---|---|---|---|---|---|---|---|---|---|---|---|
| 2009 | 36 | 35 | 33 | 33 | 25 | 27 | 25 | 34 | 36 | 34 | 41 | 42 |
| 2010 | 122 | 141 | 168 | 151 | 174 | 194 | 185 | 148 | 123 | 124 | 113 | 119 |
| 2011 | 129 | 117 | 120 | 139 | 171 | 225 | 138 | 153 | 143 | 165 | 122 | 157 |
| 2012 | 198 | 212 | 224 | 200 | 163 | 147 | 171 | 128 | 130 | 135 | 163 | 311 |
| 2013 | 268 | 233 | 366 | 416 | 537 | 435 | 555 | 909 | 761 | 844 | 1,142 | 1,075 |
| 2014 | 1,002 | 880 | 837 | 601 | 488 | 401 | 688 | 439 | 460 | 462 | 472 | 656 |
| 2015 | 791 | 820 | 825 | 872 | 919 | 774 | 928 | 1,250 | 1,128 | 1,244 | 1,136 | 949 |
| 2016 | 1,252 | 1,066 | 980 | 1,197 | 1,154 | 1,394 | 1,322 | 1,571 | 1,318 | 1,472 | 1,495 | 1,776 |
| 2017 | 1,545 | 1,549 | 1,472 | 1,444 | 1,211 | 1,053 | 987 | 985 | 1,189 | 1,266 | 1,352 | 1,176 |
| 2018 | 1,542 | 1,632 | 1,497 | 1,730 | 1,468 | 1,462 | 1,308 | 1,258 | 1,219 | 1,503 | 1,532 | 1,789 |
| 2019 | 2,159 | 2,183 | 2,152 | 2,010 | 2,029 | 2,085 | 1,962 | 1,645 | 1,710 | 1,755 | 1,807 | 1,553 |
| 2020 | 1,875 | 1,656 | 1,760 | 1,684 | 1,722 | 1,663 | 1,462 | 1,249 | 1,354 | 1,429 | 1,473 | 1,660 |
| 2021 | 1,994 | 2,003 | 2,173 | 1,825 | 1,790 | 2,292 | 2,307 | 2,316 | 2,244 | 2,004 | 2,329 | 2,635 |
| 2022 | 2,930 | 3,077 | 2,862 | 2,606 | 3,083 | 2,685 | 2,777 | 2,278 | 2,363 | 1,970 | 2,498 | 3,147 |
| 2023 | 3,239 | 3,438 | 3,342 | 3,815 | 3,195 | 3,024 | 3,189 | 3,482 | 3,483 | 2,868 | 3,830 | 4,158 |
| 2024 | 4,874 | |||||||||||
| - = No Data Reported; -- = Not Applicable; NA = Not Available; W = Withheld to avoid disclosure of individual company data. |
| Release Date: 3/29/2024 |
| Next Release Date: 4/30/2024 |