|
Download Data (XLS File) |
|
||||||||
|
||||||||
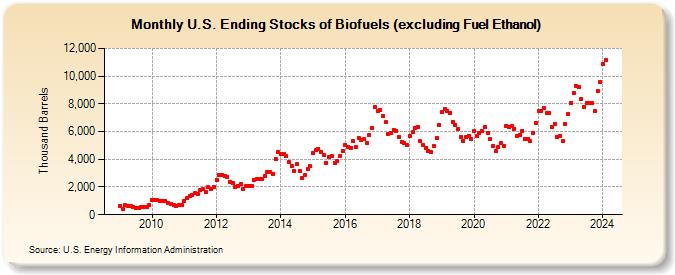
| U.S. Ending Stocks of Biofuels (excluding Fuel Ethanol) (Thousand Barrels) | ||||||||
| Year | Jan | Feb | Mar | Apr | May | Jun | Jul | Aug | Sep | Oct | Nov | Dec |
|---|---|---|---|---|---|---|---|---|---|---|---|---|
| 2009 | 664 | 424 | 665 | 632 | 600 | 581 | 511 | 511 | 527 | 553 | 531 | 711 |
| 2010 | 1,049 | 1,039 | 1,057 | 1,009 | 1,016 | 968 | 830 | 771 | 682 | 650 | 676 | 672 |
| 2011 | 1,016 | 1,217 | 1,381 | 1,408 | 1,576 | 1,524 | 1,748 | 1,834 | 1,617 | 1,965 | 1,877 | 2,012 |
| 2012 | 2,510 | 2,895 | 2,893 | 2,783 | 2,710 | 2,348 | 2,262 | 2,011 | 2,059 | 2,183 | 1,865 | 2,083 |
| 2013 | 2,090 | 2,093 | 2,491 | 2,588 | 2,598 | 2,565 | 2,793 | 3,099 | 3,051 | 2,970 | 4,029 | 4,506 |
| 2014 | 4,388 | 4,364 | 4,210 | 3,783 | 3,537 | 3,155 | 3,690 | 3,157 | 2,676 | 2,864 | 3,311 | 3,488 |
| 2015 | 4,441 | 4,635 | 4,776 | 4,538 | 4,319 | 3,761 | 4,135 | 4,216 | 3,753 | 3,890 | 4,268 | 4,581 |
| 2016 | 5,023 | 4,898 | 4,840 | 5,296 | 4,876 | 5,552 | 5,406 | 5,432 | 5,165 | 5,739 | 6,262 | 7,756 |
| 2017 | 7,466 | 7,530 | 7,142 | 6,665 | 5,809 | 5,869 | 6,139 | 6,058 | 5,612 | 5,250 | 5,139 | 5,049 |
| 2018 | 5,711 | 5,982 | 6,276 | 6,319 | 5,290 | 5,027 | 4,819 | 4,611 | 4,513 | 4,952 | 5,527 | 6,443 |
| 2019 | 7,375 | 7,657 | 7,499 | 7,358 | 6,711 | 6,505 | 6,180 | 5,616 | 5,309 | 5,599 | 5,703 | 5,448 |
| 2020 | 6,032 | 5,651 | 5,907 | 6,014 | 6,302 | 5,900 | 5,429 | 4,983 | 4,610 | 4,874 | 5,155 | 4,979 |
| 2021 | 6,429 | 6,319 | 6,382 | 6,206 | 5,683 | 5,742 | 6,069 | 5,490 | 5,475 | 5,312 | 5,922 | 6,623 |
| 2022 | 7,464 | 7,496 | 7,689 | 7,343 | 7,330 | 6,337 | 6,579 | 5,627 | 5,700 | 5,316 | 6,563 | 7,296 |
| 2023 | 8,326 | 8,920 | 9,508 | 9,411 | 8,466 | 7,863 | 8,028 | 8,009 | 8,146 | 7,505 | 8,956 | 9,606 |
| 2024 | 10,844 | 11,150 | 11,036 | 11,471 | 10,480 | 10,750 | ||||||
| - = No Data Reported; -- = Not Applicable; NA = Not Available; W = Withheld to avoid disclosure of individual company data. |
| Release Date: 8/30/2024 |
| Next Release Date: 9/30/2024 |