|
Download Data (XLS File) |
|
||||||||
|
||||||||
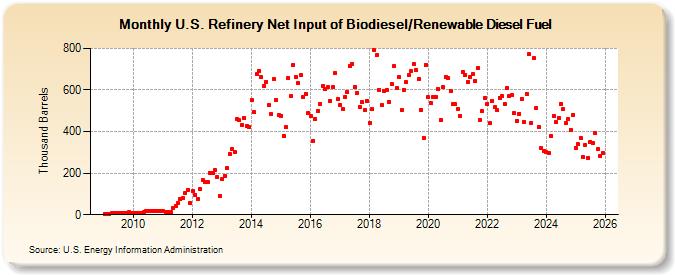
| U.S. Refinery Net Input of Biodiesel/Renewable Diesel Fuel (Thousand Barrels) | ||||||||
| Year | Jan | Feb | Mar | Apr | May | Jun | Jul | Aug | Sep | Oct | Nov | Dec |
|---|---|---|---|---|---|---|---|---|---|---|---|---|
| 2009 | 4 | 4 | 3 | 6 | 8 | 10 | 8 | 8 | 8 | 7 | 11 | 10 |
| 2010 | 7 | 10 | 9 | 10 | 14 | 19 | 19 | 16 | 18 | 19 | 18 | 16 |
| 2011 | 16 | 13 | 14 | 13 | 30 | 41 | 54 | 74 | 78 | 104 | 119 | 57 |
| 2012 | 115 | 95 | 77 | 126 | 168 | 159 | 156 | 202 | 202 | 213 | 179 | 91 |
| 2013 | 172 | 188 | 223 | 294 | 318 | 300 | 460 | 454 | 433 | 467 | 428 | 420 |
| 2014 | 550 | 494 | 675 | 691 | 660 | 620 | 640 | 526 | 484 | 652 | 553 | 479 |
| 2015 | 476 | 379 | 421 | 659 | 570 | 721 | 662 | 633 | 670 | 564 | 582 | 488 |
| 2016 | 476 | 355 | 460 | 501 | 534 | 620 | 603 | 613 | 548 | 615 | 682 | 555 |
| 2017 | 530 | 508 | 568 | 590 | 716 | 725 | 615 | 587 | 518 | 540 | 504 | 548 |
| 2018 | 443 | 509 | 790 | 767 | 602 | 527 | 595 | 600 | 542 | 628 | 714 | 608 |
| 2019 | 660 | 504 | 602 | 637 | 670 | 689 | 725 | 696 | 655 | 506 | 371 | 722 |
| 2020 | 564 | 537 | 568 | 568 | 604 | 456 | 612 | 664 | 656 | 597 | 533 | 531 |
| 2021 | 510 | 477 | 687 | 673 | 638 | 664 | 675 | 643 | 707 | 456 | 497 | 563 |
| 2022 | 534 | 439 | 546 | 516 | 502 | 563 | 570 | 532 | 610 | 573 | 575 | 488 |
| 2023 | 450 | 486 | 558 | 448 | 582 | 773 | 443 | 754 | 514 | 421 | 319 | 308 |
| 2024 | 300 | 298 | 379 | 477 | 444 | 467 | ||||||
| - = No Data Reported; -- = Not Applicable; NA = Not Available; W = Withheld to avoid disclosure of individual company data. |
| Release Date: 8/30/2024 |
| Next Release Date: 9/30/2024 |