|
Download Data (XLS File) |
|
||||||||
|
||||||||
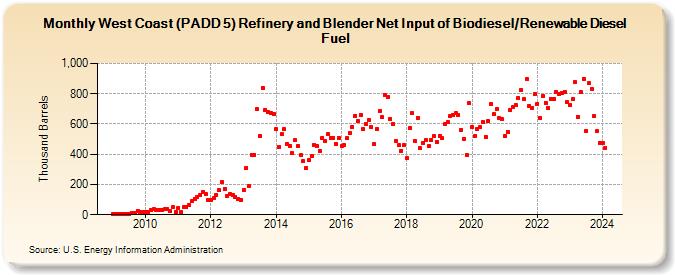
| West Coast (PADD 5) Refinery and Blender Net Input of Biodiesel/Renewable Diesel Fuel (Thousand Barrels) | ||||||||
| Year | Jan | Feb | Mar | Apr | May | Jun | Jul | Aug | Sep | Oct | Nov | Dec |
|---|---|---|---|---|---|---|---|---|---|---|---|---|
| 2009 | 4 | 4 | 7 | 5 | 7 | 7 | 7 | 13 | 13 | 26 | 20 | 19 |
| 2010 | 21 | 21 | 30 | 36 | 28 | 31 | 32 | 35 | 38 | 24 | 48 | 21 |
| 2011 | 45 | 21 | 48 | 48 | 64 | 92 | 107 | 115 | 129 | 150 | 134 | 98 |
| 2012 | 98 | 109 | 130 | 162 | 215 | 172 | 127 | 140 | 132 | 118 | 105 | 100 |
| 2013 | 166 | 312 | 190 | 398 | 397 | 697 | 521 | 841 | 692 | 677 | 674 | 664 |
| 2014 | 566 | 448 | 533 | 566 | 468 | 455 | 405 | 492 | 457 | 392 | 353 | 312 |
| 2015 | 363 | 389 | 463 | 456 | 424 | 509 | 490 | 532 | 509 | 509 | 468 | 506 |
| 2016 | 454 | 460 | 505 | 541 | 582 | 656 | 619 | 660 | 568 | 603 | 626 | 580 |
| 2017 | 467 | 568 | 686 | 644 | 793 | 781 | 632 | 600 | 490 | 459 | 422 | 464 |
| 2018 | 373 | 571 | 672 | 486 | 642 | 440 | 476 | 494 | 455 | 494 | 520 | 483 |
| 2019 | 522 | 505 | 598 | 611 | 654 | 662 | 671 | 660 | 561 | 502 | 396 | 737 |
| 2020 | 579 | 522 | 570 | 577 | 612 | 516 | 618 | 732 | 663 | 698 | 640 | 631 |
| 2021 | 521 | 550 | 690 | 711 | 725 | 772 | 825 | 764 | 895 | 721 | 707 | 798 |
| 2022 | 734 | 641 | 782 | 741 | 705 | 767 | 763 | 809 | 799 | 806 | 814 | 743 |
| 2023 | 724 | 765 | 877 | 648 | 809 | 900 | 556 | 869 | 833 | 651 | 551 | 477 |
| 2024 | 476 | |||||||||||
| - = No Data Reported; -- = Not Applicable; NA = Not Available; W = Withheld to avoid disclosure of individual company data. |
| Release Date: 3/29/2024 |
| Next Release Date: 4/30/2024 |