|
Download Data (XLS File) |
|
||||||||
|
||||||||
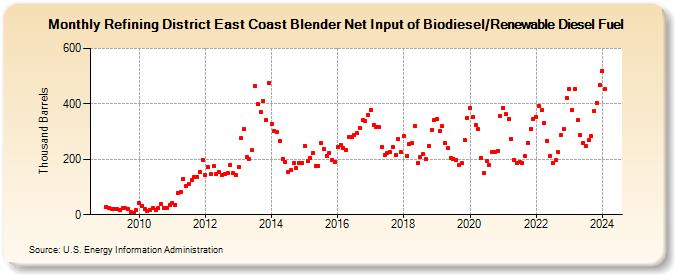
| Refining District East Coast Blender Net Input of Biodiesel/Renewable Diesel Fuel (Thousand Barrels) | ||||||||
| Year | Jan | Feb | Mar | Apr | May | Jun | Jul | Aug | Sep | Oct | Nov | Dec |
|---|---|---|---|---|---|---|---|---|---|---|---|---|
| 2009 | 29 | 26 | 22 | 21 | 20 | 16 | 24 | 23 | 21 | 11 | 6 | 16 |
| 2010 | 41 | 33 | 21 | 12 | 17 | 24 | 17 | 23 | 38 | 26 | 25 | 35 |
| 2011 | 43 | 36 | 79 | 83 | 130 | 102 | 109 | 126 | 135 | 137 | 153 | 199 |
| 2012 | 142 | 171 | 147 | 174 | 146 | 154 | 144 | 146 | 150 | 179 | 149 | 143 |
| 2013 | 173 | 275 | 309 | 207 | 202 | 232 | 466 | 398 | 370 | 410 | 342 | 475 |
| 2014 | 329 | 302 | 299 | 266 | 202 | 191 | 153 | 162 | 188 | 168 | 187 | 188 |
| 2015 | 248 | 194 | 204 | 223 | 176 | 176 | 259 | 237 | 212 | 224 | 199 | 190 |
| 2016 | 245 | 250 | 241 | 235 | 281 | 280 | 289 | 293 | 312 | 340 | 338 | 359 |
| 2017 | 379 | 322 | 318 | 315 | 244 | 215 | 223 | 225 | 243 | 215 | 272 | 225 |
| 2018 | 283 | 212 | 256 | 259 | 321 | 186 | 208 | 218 | 200 | 247 | 306 | 341 |
| 2019 | 344 | 302 | 319 | 260 | 240 | 205 | 202 | 197 | 180 | 185 | 269 | 348 |
| 2020 | 386 | 351 | 324 | 309 | 206 | 149 | 194 | 179 | 225 | 227 | 230 | 357 |
| 2021 | 386 | 362 | 346 | 272 | 199 | 187 | 189 | 187 | 212 | 260 | 309 | 345 |
| 2022 | 354 | 392 | 377 | 330 | 267 | 212 | 187 | 197 | 227 | 286 | 310 | 422 |
| 2023 | 455 | 378 | 452 | 340 | 288 | 258 | 249 | 268 | 287 | 374 | 404 | 468 |
| 2024 | 519 | 453 | 402 | 364 | 294 | 267 | ||||||
| - = No Data Reported; -- = Not Applicable; NA = Not Available; W = Withheld to avoid disclosure of individual company data. |
| Release Date: 8/30/2024 |
| Next Release Date: 9/30/2024 |