|
Download Data (XLS File) |
|
||||||||
|
||||||||
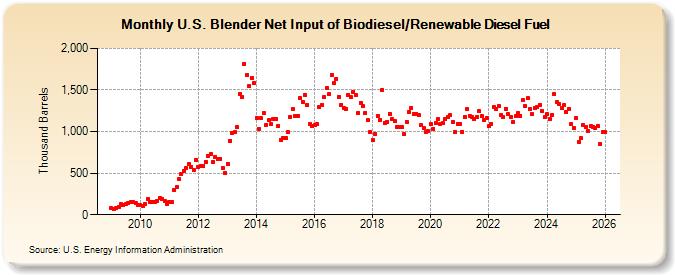
| U.S. Blender Net Input of Biodiesel/Renewable Diesel Fuel (Thousand Barrels) | ||||||||
| Year | Jan | Feb | Mar | Apr | May | Jun | Jul | Aug | Sep | Oct | Nov | Dec |
|---|---|---|---|---|---|---|---|---|---|---|---|---|
| 2009 | 75 | 69 | 76 | 87 | 128 | 115 | 125 | 138 | 152 | 153 | 135 | 117 |
| 2010 | 118 | 107 | 130 | 185 | 154 | 157 | 154 | 170 | 201 | 190 | 167 | 134 |
| 2011 | 157 | 154 | 293 | 331 | 430 | 493 | 526 | 565 | 609 | 579 | 532 | 661 |
| 2012 | 573 | 587 | 588 | 637 | 710 | 732 | 638 | 697 | 665 | 671 | 565 | 504 |
| 2013 | 615 | 890 | 980 | 994 | 1,050 | 1,452 | 1,414 | 1,817 | 1,678 | 1,545 | 1,648 | 1,586 |
| 2014 | 1,163 | 1,035 | 1,162 | 1,228 | 1,083 | 1,135 | 1,087 | 1,147 | 1,154 | 1,069 | 899 | 917 |
| 2015 | 920 | 991 | 1,180 | 1,268 | 1,188 | 1,191 | 1,403 | 1,361 | 1,441 | 1,321 | 1,092 | 1,065 |
| 2016 | 1,075 | 1,087 | 1,296 | 1,322 | 1,410 | 1,526 | 1,450 | 1,684 | 1,586 | 1,635 | 1,420 | 1,324 |
| 2017 | 1,287 | 1,272 | 1,443 | 1,410 | 1,480 | 1,437 | 1,227 | 1,348 | 1,303 | 1,226 | 1,133 | 995 |
| 2018 | 896 | 974 | 1,192 | 1,140 | 1,500 | 1,108 | 1,118 | 1,215 | 1,146 | 1,127 | 1,058 | 1,053 |
| 2019 | 1,060 | 966 | 1,116 | 1,241 | 1,285 | 1,216 | 1,216 | 1,202 | 1,077 | 1,038 | 992 | 1,001 |
| 2020 | 1,086 | 1,032 | 1,104 | 1,148 | 1,091 | 1,100 | 1,154 | 1,171 | 1,196 | 1,112 | 1,000 | 1,095 |
| 2021 | 1,087 | 1,000 | 1,178 | 1,271 | 1,187 | 1,171 | 1,148 | 1,173 | 1,242 | 1,185 | 1,137 | 1,163 |
| 2022 | 1,063 | 1,093 | 1,296 | 1,275 | 1,305 | 1,201 | 1,173 | 1,277 | 1,208 | 1,179 | 1,115 | 1,186 |
| 2023 | 1,220 | 1,190 | 1,378 | 1,303 | 1,399 | 1,266 | 1,207 | 1,286 | 1,301 | 1,324 | 1,245 | 1,174 |
| 2024 | 1,205 | 1,146 | 1,199 | 1,454 | 1,349 | 1,326 | ||||||
| - = No Data Reported; -- = Not Applicable; NA = Not Available; W = Withheld to avoid disclosure of individual company data. |
| Release Date: 8/30/2024 |
| Next Release Date: 9/30/2024 |