|
Download Data (XLS File) |
|
||||||||
|
||||||||
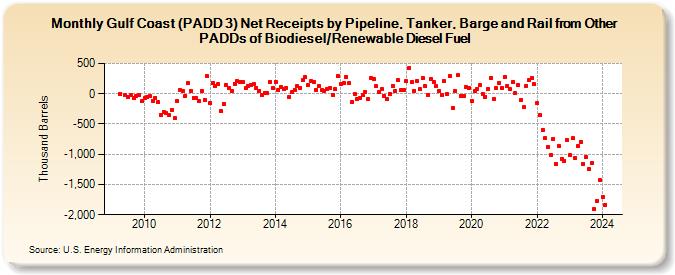
| Gulf Coast (PADD 3) Net Receipts by Pipeline, Tanker, Barge and Rail from Other PADDs of Biodiesel/Renewable Diesel Fuel (Thousand Barrels) | ||||||||
| Year | Jan | Feb | Mar | Apr | May | Jun | Jul | Aug | Sep | Oct | Nov | Dec |
|---|---|---|---|---|---|---|---|---|---|---|---|---|
| 2009 | -4 | -27 | -60 | -27 | -77 | -40 | -27 | -127 | ||||
| 2010 | -72 | -58 | -39 | -115 | -66 | -143 | -351 | -296 | -326 | -358 | -261 | -406 |
| 2011 | -114 | 64 | 41 | -30 | 176 | 50 | -64 | -73 | -126 | 49 | -97 | 286 |
| 2012 | -151 | 182 | 121 | 159 | -285 | -167 | 144 | 87 | 46 | 168 | 206 | 188 |
| 2013 | 188 | 93 | 126 | 150 | 156 | 96 | 50 | -27 | 13 | 8 | 199 | 97 |
| 2014 | 200 | 54 | 113 | 76 | 95 | -55 | 26 | 69 | 121 | 100 | 220 | 273 |
| 2015 | 137 | 209 | 193 | 59 | 127 | 54 | 51 | 71 | 93 | -16 | 75 | 293 |
| 2016 | 160 | 176 | 280 | 171 | -140 | -4 | -91 | -69 | -15 | 34 | -93 | 263 |
| 2017 | 237 | 126 | 21 | 82 | -40 | -84 | 2 | 133 | 51 | 220 | 60 | 65 |
| 2018 | 205 | 424 | 196 | 50 | 218 | 77 | 264 | 122 | -19 | 249 | 186 | 123 |
| 2019 | 44 | -21 | 210 | -12 | 293 | -228 | 37 | 305 | -31 | -38 | 103 | 95 |
| 2020 | -114 | 42 | 82 | 138 | -5 | -46 | 76 | 259 | -79 | 90 | 176 | 97 |
| 2021 | 275 | 129 | 70 | 187 | 6 | 141 | -108 | -226 | 134 | 231 | 263 | 153 |
| 2022 | -160 | -353 | -595 | -740 | -876 | -1,012 | -748 | -1,165 | -868 | -1,074 | -1,104 | -771 |
| 2023 | -1,019 | -738 | -1,058 | -864 | -794 | -1,161 | -1,042 | -1,243 | -1,148 | -1,910 | -1,771 | -1,433 |
| 2024 | -1,699 | |||||||||||
| - = No Data Reported; -- = Not Applicable; NA = Not Available; W = Withheld to avoid disclosure of individual company data. |
| Release Date: 3/29/2024 |
| Next Release Date: 4/30/2024 |
Referring Pages: