|
Download Data (XLS File) |
|
||||||||
|
||||||||
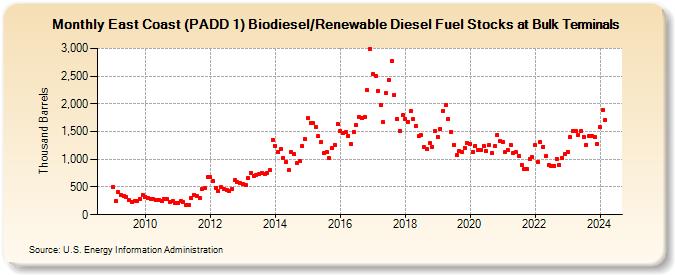
| East Coast (PADD 1) Biodiesel/Renewable Diesel Fuel Stocks at Bulk Terminals (Thousand Barrels) | ||||||||
| Year | Jan | Feb | Mar | Apr | May | Jun | Jul | Aug | Sep | Oct | Nov | Dec |
|---|---|---|---|---|---|---|---|---|---|---|---|---|
| 2009 | 504 | 241 | 409 | 352 | 340 | 316 | 264 | 228 | 250 | 247 | 284 | 360 |
| 2010 | 321 | 297 | 281 | 275 | 265 | 271 | 252 | 284 | 285 | 235 | 243 | 211 |
| 2011 | 205 | 240 | 227 | 178 | 184 | 310 | 363 | 337 | 304 | 464 | 476 | 679 |
| 2012 | 676 | 603 | 489 | 426 | 494 | 456 | 439 | 420 | 466 | 626 | 588 | 570 |
| 2013 | 550 | 530 | 665 | 758 | 707 | 713 | 733 | 755 | 741 | 753 | 805 | 1,355 |
| 2014 | 1,241 | 1,126 | 1,188 | 1,029 | 953 | 800 | 1,123 | 1,094 | 924 | 971 | 1,236 | 1,365 |
| 2015 | 1,736 | 1,653 | 1,646 | 1,588 | 1,413 | 1,316 | 1,107 | 1,131 | 1,015 | 1,197 | 1,265 | 1,636 |
| 2016 | 1,515 | 1,475 | 1,487 | 1,418 | 1,275 | 1,489 | 1,618 | 1,759 | 1,743 | 1,759 | 2,247 | 2,989 |
| 2017 | 2,530 | 2,506 | 2,238 | 1,987 | 1,669 | 2,187 | 2,427 | 2,780 | 2,167 | 1,732 | 1,518 | 1,791 |
| 2018 | 1,727 | 1,680 | 1,865 | 1,722 | 1,604 | 1,417 | 1,444 | 1,213 | 1,188 | 1,287 | 1,230 | 1,510 |
| 2019 | 1,410 | 1,540 | 1,873 | 1,982 | 1,727 | 1,500 | 1,262 | 1,072 | 1,155 | 1,137 | 1,209 | 1,298 |
| 2020 | 1,281 | 1,132 | 1,245 | 1,171 | 1,176 | 1,241 | 1,148 | 1,253 | 1,113 | 1,238 | 1,430 | 1,325 |
| 2021 | 1,319 | 1,137 | 1,173 | 1,263 | 1,112 | 1,131 | 1,065 | 902 | 826 | 830 | 1,002 | 1,036 |
| 2022 | 1,257 | 958 | 1,319 | 1,226 | 1,054 | 892 | 878 | 885 | 1,006 | 894 | 1,028 | 1,097 |
| 2023 | 1,147 | 1,404 | 1,509 | 1,512 | 1,440 | 1,503 | 1,405 | 1,284 | 1,438 | 1,424 | 1,393 | 1,282 |
| 2024 | 1,574 | 1,889 | 1,710 | 2,069 | 1,850 | 1,987 | ||||||
| - = No Data Reported; -- = Not Applicable; NA = Not Available; W = Withheld to avoid disclosure of individual company data. |
| Release Date: 8/30/2024 |
| Next Release Date: 9/30/2024 |