|
Download Data (XLS File) |
|
||||||||
|
||||||||
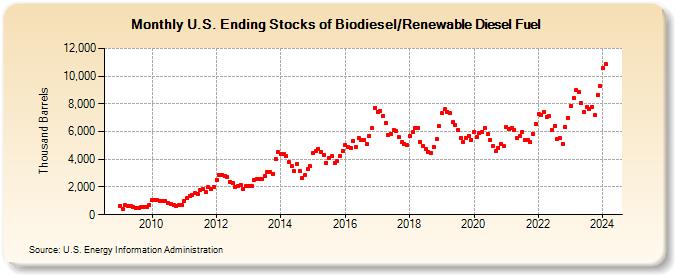
| U.S. Ending Stocks of Biodiesel/Renewable Diesel Fuel (Thousand Barrels) | ||||||||
| Year | Jan | Feb | Mar | Apr | May | Jun | Jul | Aug | Sep | Oct | Nov | Dec |
|---|---|---|---|---|---|---|---|---|---|---|---|---|
| 2009 | 664 | 424 | 665 | 632 | 600 | 581 | 511 | 511 | 527 | 553 | 531 | 711 |
| 2010 | 1,049 | 1,039 | 1,057 | 1,009 | 1,016 | 968 | 830 | 771 | 682 | 650 | 676 | 672 |
| 2011 | 1,016 | 1,217 | 1,381 | 1,408 | 1,576 | 1,524 | 1,748 | 1,834 | 1,617 | 1,965 | 1,877 | 2,012 |
| 2012 | 2,510 | 2,895 | 2,893 | 2,783 | 2,710 | 2,348 | 2,262 | 2,011 | 2,049 | 2,176 | 1,862 | 2,078 |
| 2013 | 2,081 | 2,084 | 2,486 | 2,583 | 2,590 | 2,562 | 2,792 | 3,095 | 3,046 | 2,969 | 4,025 | 4,501 |
| 2014 | 4,378 | 4,353 | 4,203 | 3,776 | 3,527 | 3,144 | 3,684 | 3,149 | 2,667 | 2,864 | 3,306 | 3,481 |
| 2015 | 4,435 | 4,627 | 4,776 | 4,538 | 4,315 | 3,757 | 4,126 | 4,212 | 3,746 | 3,880 | 4,257 | 4,577 |
| 2016 | 5,015 | 4,888 | 4,829 | 5,285 | 4,865 | 5,516 | 5,374 | 5,394 | 5,115 | 5,703 | 6,228 | 7,713 |
| 2017 | 7,420 | 7,487 | 7,109 | 6,632 | 5,770 | 5,838 | 6,113 | 6,034 | 5,580 | 5,217 | 5,114 | 5,021 |
| 2018 | 5,680 | 5,946 | 6,230 | 6,275 | 5,247 | 4,980 | 4,769 | 4,559 | 4,470 | 4,905 | 5,474 | 6,389 |
| 2019 | 7,319 | 7,599 | 7,438 | 7,314 | 6,668 | 6,463 | 6,136 | 5,567 | 5,260 | 5,559 | 5,658 | 5,398 |
| 2020 | 5,987 | 5,608 | 5,860 | 5,968 | 6,254 | 5,854 | 5,387 | 4,942 | 4,577 | 4,844 | 5,128 | 4,952 |
| 2021 | 6,293 | 6,168 | 6,251 | 6,105 | 5,564 | 5,668 | 5,980 | 5,406 | 5,404 | 5,223 | 5,854 | 6,540 |
| 2022 | 7,253 | 7,205 | 7,397 | 7,085 | 7,113 | 6,146 | 6,389 | 5,448 | 5,524 | 5,138 | 6,320 | 7,013 |
| 2023 | 7,854 | 8,427 | 8,974 | 8,881 | 8,051 | 7,399 | 7,757 | 7,628 | 7,796 | 7,182 | 8,659 | 9,305 |
| 2024 | 10,584 | |||||||||||
| - = No Data Reported; -- = Not Applicable; NA = Not Available; W = Withheld to avoid disclosure of individual company data. |
| Release Date: 3/29/2024 |
| Next Release Date: 4/30/2024 |