|
Download Data (XLS File) |
|
||||||||
|
||||||||
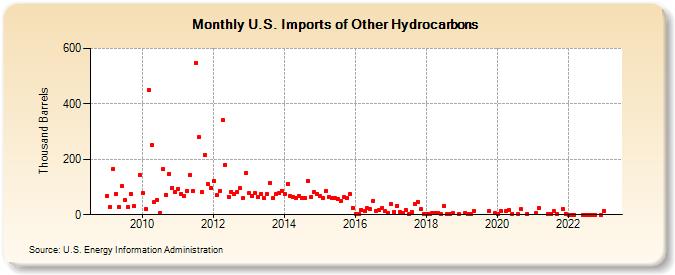
| U.S. Imports of Other Hydrocarbons (Thousand Barrels) | ||||||||
| Year | Jan | Feb | Mar | Apr | May | Jun | Jul | Aug | Sep | Oct | Nov | Dec |
|---|---|---|---|---|---|---|---|---|---|---|---|---|
| 2009 | 68 | 28 | 165 | 76 | 28 | 104 | 54 | 28 | 76 | 31 | 144 | |
| 2010 | 78 | 19 | 449 | 250 | 46 | 54 | 7 | 164 | 72 | 148 | 97 | 82 |
| 2011 | 93 | 76 | 66 | 86 | 144 | 84 | 549 | 279 | 83 | 216 | 109 | 96 |
| 2012 | 121 | 71 | 85 | 341 | 181 | 65 | 83 | 73 | 82 | 96 | 61 | 150 |
| 2013 | 77 | 69 | 78 | 64 | 75 | 61 | 74 | 116 | 61 | 73 | 77 | 87 |
| 2014 | 73 | 112 | 67 | 63 | 62 | 67 | 62 | 60 | 123 | 63 | 82 | 76 |
| 2015 | 67 | 60 | 86 | 63 | 62 | 59 | 58 | 49 | 63 | 60 | 73 | 26 |
| 2016 | 3 | 4 | 18 | 13 | 23 | 19 | 50 | 15 | 16 | 26 | 13 | 5 |
| 2017 | 38 | 10 | 33 | 10 | 5 | 17 | 3 | 10 | 40 | 47 | 19 | 4 |
| 2018 | 4 | 4 | 7 | 6 | 7 | 1 | 32 | 2 | 4 | 5 | 3 | |
| 2019 | 7 | 1 | 4 | 15 | 12 | 5 | ||||||
| 2020 | 3 | 13 | 14 | 17 | 4 | 3 | 19 | 3 | ||||
| 2021 | 5 | 24 | 4 | 4 | 13 | 4 | 20 | 4 | ||||
| 2022 | 0 | 0 | 0 | 0 | 0 | 0 | 0 | 0 | 0 | |||
| 2023 | 15 | |||||||||||
| - = No Data Reported; -- = Not Applicable; NA = Not Available; W = Withheld to avoid disclosure of individual company data. |
| Release Date: 3/29/2024 |
| Next Release Date: 4/30/2024 |