|
Download Data (XLS File) |
|
||||||||
|
||||||||
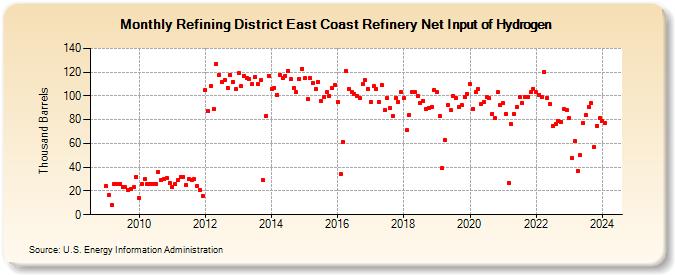
| Refining District East Coast Refinery Net Input of Hydrogen (Thousand Barrels) | ||||||||
| Year | Jan | Feb | Mar | Apr | May | Jun | Jul | Aug | Sep | Oct | Nov | Dec |
|---|---|---|---|---|---|---|---|---|---|---|---|---|
| 2009 | 24 | 17 | 8 | 26 | 26 | 26 | 23 | 23 | 21 | 22 | 23 | 32 |
| 2010 | 14 | 26 | 30 | 26 | 26 | 26 | 26 | 36 | 29 | 30 | 31 | 27 |
| 2011 | 23 | 26 | 29 | 32 | 32 | 25 | 30 | 29 | 30 | 24 | 21 | 16 |
| 2012 | 105 | 87 | 108 | 89 | 127 | 118 | 112 | 113 | 107 | 118 | 112 | 106 |
| 2013 | 119 | 108 | 117 | 115 | 114 | 110 | 116 | 110 | 113 | 29 | 83 | 117 |
| 2014 | 106 | 107 | 101 | 118 | 115 | 117 | 121 | 114 | 107 | 103 | 114 | 123 |
| 2015 | 115 | 97 | 115 | 111 | 106 | 112 | 96 | 99 | 103 | 100 | 107 | 109 |
| 2016 | 95 | 34 | 61 | 121 | 106 | 103 | 102 | 100 | 98 | 110 | 113 | 106 |
| 2017 | 95 | 108 | 106 | 95 | 109 | 88 | 98 | 90 | 83 | 98 | 95 | 103 |
| 2018 | 98 | 71 | 84 | 103 | 103 | 100 | 94 | 96 | 89 | 90 | 91 | 105 |
| 2019 | 103 | 83 | 39 | 63 | 92 | 88 | 100 | 98 | 91 | 92 | 99 | 102 |
| 2020 | 110 | 89 | 103 | 106 | 93 | 95 | 99 | 98 | 85 | 81 | 103 | 92 |
| 2021 | 94 | 85 | 27 | 76 | 85 | 91 | 99 | 94 | 99 | 99 | 103 | 106 |
| 2022 | 103 | 101 | 99 | 120 | 98 | 93 | 75 | 76 | 79 | 78 | 89 | 88 |
| 2023 | 81 | 48 | 62 | 37 | 50 | 77 | 84 | 91 | 94 | 57 | 75 | 81 |
| 2024 | 79 | |||||||||||
| - = No Data Reported; -- = Not Applicable; NA = Not Available; W = Withheld to avoid disclosure of individual company data. |
| Release Date: 3/29/2024 |
| Next Release Date: 4/30/2024 |
Referring Pages: